

Archive

August 2026

Browsing

The Vanguard S&P 500 ETF (VOO) and the iShares Russell 200 Index Fund (IWM) have jumped to their record highs this year. IWM has jumped by over 21% this year, while VOO is up by 12.50% in the same period. This article highlights some of the top reasons why these ETFs may continue rising this year.

VOO and IWM ETFs YTD performance | Source: TradingView

US corporate earnings growth is still strong

The main catalyst for US stocks is that their earnings growth is accelerating, helped by the artificial intelligence boom, tariff refunds, and energy prices.

A recent report by FactSet shows that nearly all companies in the S&P 500 Index have published their second-quarter earnings. The earnings growth in this period stood at over 50%, much higher than what analysts were expecting. This growth was the fastest one since 2021.

Most importantly, many companies have boosted their forward guidance, a sign that they expect the earnings momentum to continue. 

This earnings growth is coming at a difficult time as the US-Iran war continues, and Iran has hinted that it will escalate to push the US to make an agreement. The war has led to higher inflation in the US, with the headline and core CPI metrics remaining above the 2% target level.

There are also signs that the US economy is slowing. The US lost 23,000 jobs last month, while retail sales have slowed substantially. These numbers show a big disconnect between the real economy and Wall Street.

Odds of a Fed hike are falling

The VOO and IWM ETFs may also benefit from the actions of the Federal Reserve. For most part of the year, the consensus was that the Fed would hike interest rates later this year.

Now, however, the situation has changed, and traders are paring back their Fed hike expectations. Polymarket data shows that odds that the Fed will hike rates have dropped below 50%.

Historically, stocks, especially small-cap ones, underperform when the Fed is hiking interest rates. A good example of this is what happened in 2022 when the Fed hiked rates after the Covid pandemic.

US money market fund inflows have soared

Meanwhile, money market funds have seen a surge in inflows this year as their yields jump. Data shows that the amount jumped to $8.28 trillion in the first quarter, and the trend has likely continued. 

In most cases, money market fund investors often rotate back to the stock market when its bull run continues. This normally happens because, historically, stock market returns tend to be strong than cash. 

VOO and IWM ETFs are undervalued

Despite the ongoing bull run, US stocks are trading at bargain prices. FactSet data shows that the S&P 500 Index trades at a forward 12-month price-to-earnings ratio of 20, slightly higher than its five and ten-year averages. Some of the top companies in the fund like Nvidia and Micron, are all trading at bargain levels.

The same is true with the IWM ETF, which has a price-to-earnings ratio of 19, also lower than its historical averages. As such, there is a likelihood that bargain hunters will continue buying these stocks in the near term.

These metrics explain why top analysts are boosting their estimates for the S&P 500 Index. In a statement on Monday, Evercore analysts boosted their S&P 500 forecastto 9,000 points. Other top analysts from companies like Oppenheimer and Goldman Sachs have also boosted their forecasts this year.

The post IWM and VOO have hit record highs: What next for S&P 500 and Russell 2000 ETFs? appeared first on Invezz
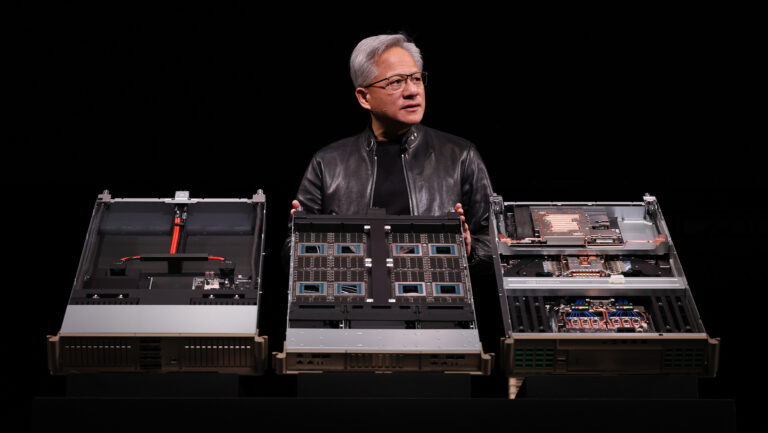

Nvidia shares (NVDA) fell around 2% in early Tuesday trading as higher Treasury yields pressured semiconductor stocks and weighed on the broader market.

The decline came alongside a wider pullback across chip stocks.

Western Digital fell almost 7%, while Sandisk dropped more than 6%. Marvell Technology and Seagate Technology also fell more than 6%.

The S&P 500 declined 0.5%, while the Nasdaq Composite fell 1.1%. The Dow Jones Industrial Average was down 191 points, or 0.4%.

The 30-year Treasury yield climbed more than 1 basis point to 5.323%, after reaching its highest level since June 2007 on Monday.

Yields have risen as investors remain concerned about persistent inflation and elevated oil prices.

US crude rose on Monday and gained another 0.9% Tuesday to trade above $85 a barrel as negotiations between the US and Iran stalled.

Nvidia rally faces broader market pressure

Nvidia’s Tuesday decline comes after a strong rebound in recent weeks.

Shares closed around $225 on Monday for a second consecutive session, a level not seen since mid-May.

The stock’s recent advance has pushed its year-to-date gain above 16%, compared with gains of about 15% for the Nasdaq Composite and 13% for the S&P 500.

From the recent market bottom on July 29, Nvidia shares have gained about 15%, compared with a 1.5% advance for the iShares Semiconductor ETF and an almost 2% gain for the VanEck Semiconductor ETF.

Nvidia had trailed those semiconductor baskets for much of the year as investors shifted toward memory and CPU stocks and renewed questions emerged over the sustainability of the company’s growth.

The recent rebound has coincided with a broader recovery in the AI infrastructure trade.

Nvidia’s increased financial support for key customers is also looking less risky than initially feared, while a new financing initiative could make funding the broader AI buildout more attainable.

New details on revenue growth at OpenAI and Anthropic, both major Nvidia chip customers, have also supported expectations that the companies can continue spending on compute.

Nvidia is scheduled to report its fiscal 2027 second-quarter results on August 26.

BofA maintains bullish view on Nvidia stock

BofA Securities reiterated its Buy rating and $350 price target on Nvidia following the company’s $105 billion in commitments related to OpenAI.

BofA said after discussions with Nvidia senior management that the chipmaker remains committed to securing chip supply, land, power and infrastructure for frontier AI labs and so-called neo-clouds.

According to BofA, the strategy is intended to diversify Nvidia’s customer base beyond public hyperscalers that are increasingly developing their own custom chips.

BofA cited solid GPU rental rates, compute scarcity and Nvidia’s free cash flow generation as factors supporting the company’s commitments.

The firm also highlighted risks if AI demand slows, which could pressure Nvidia’s growth rate and balance sheet.

BofA expects Nvidia to provide more disclosure around its off-balance-sheet commitments when it reports earnings on August 26.

BofA said Nvidia trades at 18 times and 15 times calendar 2027 and 2028 enterprise value to free cash flow, respectively, compared with its blended valuation multiples of 36 times and 22.5 times.

The firm views that valuation gap as a compelling opportunity while maintaining its $350 price target.

The post Why Nvidia stock is down over 2% on Tuesday appeared first on Invezz

Duolingo DUOL stock climbed 6.6% on Tuesday despite a broader market decline, after DA Davidson upgraded the language-learning company’s shares to Buy and raised its price target.

The move comes as investors weigh concerns about slowing user growth and monetization against continued improvements in the company’s core product and recent strategic developments.

The S&P 500 fell 0.5%, and the Nasdaq Composite declined 1.1% as higher Treasury yields, elevated oil prices and weakness in semiconductor stocks pressured equities.

DA Davidson upgrades Duolingo to Buy

DA Davidson analyst Wyatt Swanson upgraded Duolingo from Neutral to Buy and increased the firm’s price target to $160 from $130. The target price indicates a near 23% upside from Monday’s closing price.

The firm said the company could be approaching a turning point after concerns about slowing daily active user growth and monetization had weighed on the stock.

DA Davidson argued that improvements to Duolingo’s core product, changes to its marketing strategy and refinements to its monetization engine remain underappreciated by investors.

The analysts also expect daily active user growth to accelerate further, while bookings growth could converge with daily active user expansion.

The metrics have remained a focus for investors following Duolingo’s second-quarter 2026 earnings report, which showed 23% growth in daily active users alongside softer-than-expected near-term revenue guidance.

Analyst sentiment remains cautious

The upgrade comes against a largely cautious analyst backdrop. Several firms have downgraded Duolingo shares this year, including BofA Securities earlier this month.

Of the 25 analysts covering the stock, 21 have a Hold or worse rating, compared with four Buy or better recommendations.

The 12-month consensus price target stands at $124.68, below Duolingo’s Monday closing price.

Citi recently raised its price target on the company to $140 from $101, providing another positive development for the shares.

Duolingo’s stock had fallen 25.8% year to date heading into Tuesday’s session. However, the shares have gained 14.9% over the past three months, with the 10-day moving average providing support since early May.

The stock remains significantly below its 52-week high of $368.39, highlighting the extent of the decline despite the recent recovery.

Animade acquisition adds to product focus

Duolingo has also recently disclosed its acquisition of London-based animation studio Animade.

The deal brings specialized motion design capabilities into the company and reflects continued investment in its user experience.

The acquisition comes as Duolingo seeks to translate growth in its user base into higher levels of paid subscriptions.

DA Davidson’s upgrade, Citi’s higher price target and the Animade acquisition have provided several factors for investors to reassess the company’s outlook after a difficult period for the stock.

However, the broader analyst consensus remains cautious, with the majority of analysts maintaining Hold or weaker ratings.

The company’s ability to sustain daily active user growth and improve monetization will remain key factors for investors as they assess whether the recent recovery can continue.

The post Why is Duolingo stock surging 6% today appeared first on Invezz

Rocket Lab stock has rebounded in the past few weeks, moving from a low of $58.25 to $82, helped by its strong earnings and increasing backlog. It also jumped after the company inked a major deal with Viasat and other organizations. It has formed a giant double-bottom pattern, pointing to more upside in the near term.

Rocket Lab stock jumps after a major Viasat deal

RKLB stock continued rising this week, reaching a major deal with Viasat, one of the top companies in the satellite communications industry. In a statement, Rocket Lab said that it would deliver a GEO configuration of its high-performance Lightning spacecraft platform to host Viasat’s dual-band X/Ka-band payload. This project is part of the U.S. Space Force. In a statement, Peter Beck, the CEO, said:

“Moving from design into production marks an important milestone for this program and for Rocket Lab’s growing role in national security space. By pairing our vertically integrated spacecraft with Viasat’s protected communications payload, we’re delivering resilient, space-based communications infrastructure that keeps our forces connected.”

More companies and organizations have embraced Rocket Lab’s products and services. For example, it recently implemented a major contract for MDA Space, a Canadian company. This contract was part of the replenishment of Globalstar’s existing constellation, which provides direct-to-device communications services and IoT applications. The first eight of the 17 satellites were launched on August 15.

The most recent results showed that its revenue backlog jumped to $2.34 billion from $2 billion in the first quarter of the year. Its backlog in the third quarter so far was $800 million. Some of these deals are from companies like Kepler Communications, iQPS, and the Space Force.

These numbers helped to push its revenue up substantially. Its revenue jumped by 62% in the second quarter to $234 million, helped by its Space Systems business. 51% of its contracts are from commercial clients, with the rest being government. 

Rocket Lab expects that its vertical integration model will help to boost its revenue growth over time. To achieve that, it recently acquired Iridium in a $8 billion deal. Before that, it acquired Mynaric and Motiv. Mynaric is a laser communications company making optical communication terminals for space and airborne applications. Motiv, on the other hand, makes robotic arms and motor controllers.

Rocket Lab’s growth will likely continue doing well in the coming years. For example, analysts expect the upcoming results to show that its revenue to come in at $230 million, up by 60% from a year earlier. For the year, the revenue is expected to jump by 58% to $952 million, followed by $1.3 billion next year.

RKLB stock price has formed a double-bottom pattern

Rocket Lab stock chart | Source: TradingView

The daily chart shows that the RKLB stock has rebounded in the past few days. It has jumped from a low of $58.24 to $82 today. A closer look shows that the stock has slowly formed a double-bottom pattern at $58.25 and a neckline at the all-time high of $151.

The risk, however, is that the stock may be forming a head-and-shoulders pattern, a common bearish sign. In this case, the left shoulder is at $99.77. As such, the stock needs to move above the key resistance at $99.77 to confirm the bullish outlook. If this happens, it will raise the possibility of the stock soaring to an all-time high. 

On the flip side, a drop below the support level of $60 will invalidate the bullish outlook and point to more downside.

READ MORE: Analysts raise Rocket Lab stock targets after earnings: Why it could still hit $50

The post Rocket Lab stock is soaring, and a rare pattern points to gains; but there’s a catch appeared first on Invezz

The post Venice Token Price Rally Gains Momentum as Open Interest Hits $76M—$22 Next? appeared first on Coinpedia Fintech News

Venice Token (VVV) is making a decisive comeback, surging nearly 20% as open interest climbs to $76 million, signaling a sharp return of speculative capital. The move has pushed VVV toward a critical resistance zone after weeks of consolidation, while futures volume has exploded above $116 million. With momentum accelerating and traders increasing exposure, the …

The post Citi Launches Bitcoin Custody Through Custody+ Platform appeared first on Coinpedia Fintech News

Citi is preparing to offer Bitcoin custody services through its Custody+ platform, expanding its digital-asset services for institutional clients. The platform will provide 24/7 access, secure key management and faster settlement, while integrating crypto custody with existing reporting, tax and safekeeping workflows. The service will initially support Bitcoin, with plans to add other digital assets …

The post DTCC to Launch Stock Tokenization Service in October appeared first on Coinpedia Fintech News

The Depository Trust & Clearing Corporation (DTCC) plans to launch a stock tokenization service in October on the Canton Network. The service will allow institutional investors to tokenize shares of major Russell 1000 companies, including Nvidia, Apple and Microsoft, and transfer them between approved wallets. The launch follows a pilot involving 40 financial firms, including …

The post Bitcoin is Facing Rising Selling Pressure: Can BTC Price Hold Its Key Support? appeared first on Coinpedia Fintech News

The Bitcoin price is showing signs of renewed selling pressure after struggling to break above the $65,000 level. BTC is currently trading near $64,200, while a mix of on-chain and institutional data points to weakening demand and rising sell-side pressure. Exchange balances have climbed, miner reserves continue to decline, and Bitcoin ETF flows have turned …

The post Bitcoin Faces a Triple Selling Wave From Miners, Strategy and ETFs appeared first on Coinpedia Fintech News

Bitcoin is facing selling pressure from several major sources at the same time. Miners have sold BTC, spot Bitcoin ETFs have seen large outflows, and Strategy has stopped adding to its Bitcoin holdings.Meanwhile, Crypto analyst Ali Martinez notes that if selling continues to rise, the next major downside target is near $54,276. Bitcoin Miners and …

Lululemon stock continues to underperform the broader market as the company’s and industry’s challenges continue. LULU is down by 44% this year and by 71% in the last five years, a dramatic reversal for a company that was once one of the most popular among retail and institutional investors. 

LULU’s retreat has coincided with that of other top companies in the industry. Nike stockhas dropped by 50% in the last 12 months and by 77% in the last five. In Germany, Adidas has fallen by 50% in the last five years, while On Holding is down by 33% in the same period. 

Lululemon Athletica is facing pressure in key areas

Lululemon, a company whose business boomed during the pandemic, has done well in the past few years as its growth trajectory has stalled. 

It has moved from having double-digit growth to single digits. In 2023, the company’s revenue growth was nearly 30%, a figure that dropped to 4.8% last year.

The most recent results showed that its net revenue rose by just 4% in the first quarter to $2.5 billion or 2% on a constant-dollar basis. 

Most notably, its key markets are no longer doing well. Its Americas revenue dropped by 3%, a notable development since it is its most profitable. 

Its international segment’s revenue jumped by 22% in the quarter, with its comparable sales rising by 13%. While these growth metrics are good, they are much lower than where they were a few quarters ago. Mainland China’s revenue has also slowed drastically in the past few months.

The company’s profits have also plunged. Its net income dropped to $195 million in the first quarter from $314 million in the same period last year. 

Lululemon’s growth is expected to be minimal in the coming years. The average estimate among analysts is that its second-quarter revenue will be $2.46 billion, down by 2.55% from a year earlier. For the year, its revenue is expected to drop by 0.54% to $11.04 billion, followed by a modest growth next year to $11.34 billion.

Therefore, the company’s valuation has become a bargain. Its forward price-to-earnings ratio dropped to 10.5, lower than the consumer discretionary median of 17, and the five-year average of 28. Despite its cheap valuation, there is a possibility that it may be a value trap. Unless the company demonstrates a clear turnaround strategy, the stock will likely continue falling.

Lululemon stock technical analysis

LULU stock chart | Source: TradingView

The weekly chart shows that the LULU stock has been in a strong sell-off for a while. It has slumped below the important support level of $159, its lowest level in September and November last year.

Lululemon stock has slumped below the 50-week Exponential Moving Average (EMA), a sign that bears remain in control. The stock has formed a bearish flag pattern and is now in the horizontal channel. 

Therefore, the stock will likely continue falling, potentially to the key support level of $100. A move below that support will point to further downside towards $80.

The post Lululemon stock forecast: why it may crash below $100 soon appeared first on Invezz