XRP price is trading around $1.39, while wallet distribution data shows a wide gap between the amount of XRP held by smaller investors and the largest wallets. According to XRPscan data, an address needs roughly 3.65 million to 3.71 million XRP to rank among the top 0.01% of XRP holders. At the current price, that …
MNT price has broken above a months-long descending channel, putting Mantle back on traders’ radar as on-chain adoption and capital deployment accelerate. MNT is trading around $0.57, up more than 4% on the day, after reclaiming the $0.50 region and pushing through the channel resistance. Meanwhile, Mantle’s August metrics show 7.7 million unique Mainnet addresses, …
A prominent crypto analyst says the market has entered a distinct altcoin super cycle, backed by a nine-year technical breakout most traders have missed, and he’s naming the specific coins he’s personally holding through it. Ran Neuer said the current cycle is being driven by altcoin excitement rather than Bitcoin strength, pointing to the ETH/BTC …
Solana’s price is showing signs of a potential trend reversal after recovering sharply from its June lows, near $60.66. It has climbed back above $100 and is now testing a crucial resistance, with the next major target close to $115. The recent breakout has also pushed the momentum higher, but the rally now faces a …
UNI price has rallied 122% from $2.48 to around $5.14, yet Binance whale flows suggest large holders are still accumulating rather than exiting into strength. The latest data shows roughly 5,300 UNI leaving Binance on average each day, reinforcing the supply-side bullish narrative. Meanwhile, UNI has broken above a prolonged descending channel and reclaimed the …
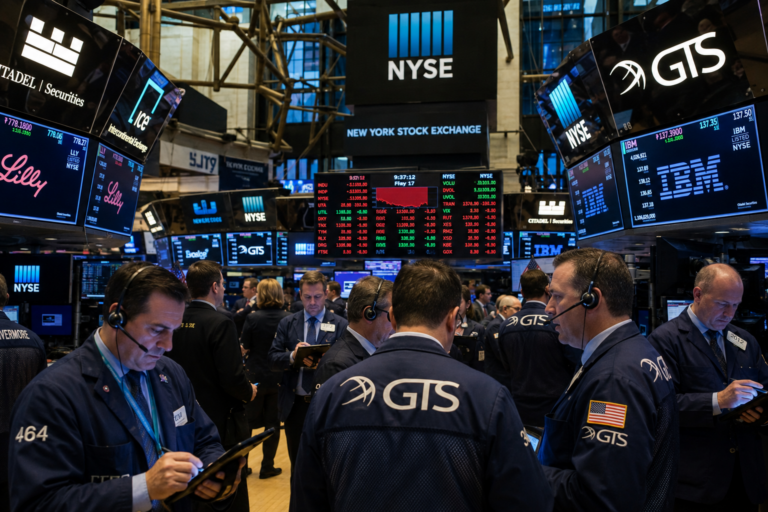
The Nasdaq Composite and the S&P 500 indices have moved sideways in the past few weeks and are all hovering near their all-time highs. NDX trades at 26,400 points, down from the year-to-date high of 27,217, while the SPX is at 7,711, down from 7,820. This article looks at the key news that will move these blue-chip indices this week.
Nasdaq Composite and S&P 500 to react to US-Iran tensions
US stocks will react to the escalating tensions between the US and Iran. The US launched an attack against Iranian launchers near the Strait of Hormuz. This was the first attack since the recent escalation ended.
Iran will likely respond by launching attacks against key US targets in the Middle East. It may also decide to boost the level of retaliation since officials know that the US military is struggling with low ammunition levels.
An escalation will make the energy situation worse. Indeed, Brent and the West Texas Intermediate (WTI) benchmarks rose to $90 and $85, respectively. Gasoline prices remain above $4 a gallon, while diesel prices have jumped to the highest level in years.
Soaring energy prices will affect inflation, which has remained elevated this month. Data released last week showed that the headline and core personal consumption expenditure (PCE) remained above 3% in May this year.
Higher inflation will likely push the Federal Reserve to hike interest rates in the December meeting. In a statement at the Jackson Hole Symposium, Kevin Warsh maintained that the bank will use all the tools available to lower the country’s inflation.
US nonfarm payrolls data
The other key catalyst for the Nasdaq Composite and S&P 500 will be the upcoming US macro data. The most important one will be the upcoming nonfarm payrollsreport on Friday this week. Economists expect this report to show that the economy added over 84k jobs in August after shedding 23k in July this year. An improvement in hiring will raise the possibility of the Fed hiking interest rates.
Before the official report, there will be some more jobs reports. The Bureau of Labor Statistics (BLS) will release the JOLTS jobs openings report on Tuesday. ADP will also release the closely watched private nonfarm payrolls (NFP) data.
The other key macro data to watch this week will be the upcoming manufacturing and services PMIs, which will provide more color on the state of the US economy.
Top corporate earnings
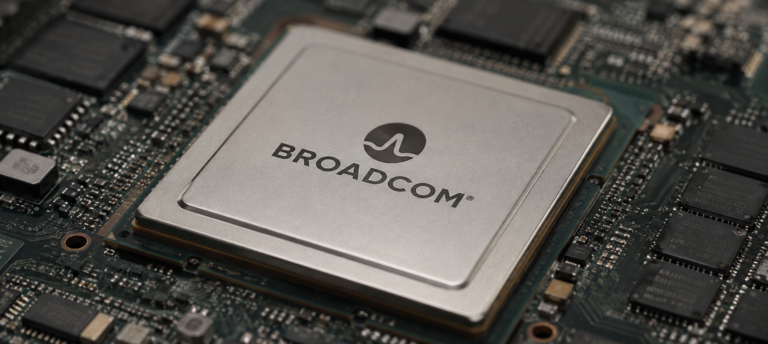
The S&P 500 and Nasdaq 100 indices will also react to several important corporate earnings from the United States. Broadcom, a top technology company, will release its earnings on Tuesday. These are important numbers because it has become one of the most important providers of services to companies in the AI space, including OpenAI.
Oracle, another top player in the AI infrastructure industry, will also release its financial results, which are expected to show that growth continued. Its main challenge is that its debt has continued rising this year.
Some of the other top companies that will release their earnings this week are names like Dell, Palo Alto Networks, Medtronic, Credo Technology Group, Snowflake,, HP Enterprise, Ciena, and Zscaler.
These earnings cap a strong season, where most companies released strong numbers, with the earnings growth rising to 50%.
Bitcoin BTC has fallen about 0.7% over the past 24 hours to around $77,800 on Aug. 31, extending its retreat after another failed attempt to hold above $80,000.
The latest decline came as global markets priced in a higher chance of another Federal Reserve rate increase following Chair Kevin Warsh’s speech at Jackson Hole on Friday.
Warsh said inflation remained too high and indicated that further tightening could be needed to return inflation to the Fed’s 2% target.
The implied probability of a September rate increase subsequently climbed to about 57% on Monday, while the two-year US Treasury yield reached its highest level in more than a month.
Barclays also revised its forecast following the speech and now expects two 25-basis-point increases, in September and December.
The bank had previously expected rates to remain unchanged through the end of 2026.
Higher yields weighed on other risk assets, with Asian equities falling on Monday and US and European stock futures trading lower as markets adjusted to the prospect of tighter monetary policy.
Renewed conflict between the US and Iran added to the selling pressure over the weekend.
US forces struck Iranian missile launchers on Larak Island, followed by retaliatory Iranian attacks against US forces in Jordan.
Brent crude subsequently rose about 3.3% to $91.01 per barrel. The rise in oil prices added to inflation concerns at a time when markets were already pricing a higher probability of another Fed rate increase.
Bitcoin entered the latest macro pressure after a strong August recovery had already stalled around $80,000.
BTC gained roughly 23% over the past month and briefly traded above $81,000 last week, but repeated attempts to establish support above the $80,000-$82,000 region failed.
Selling accelerated early on Aug. 31 after Bitcoin reached about $79,300 late on Saturday and subsequently dropped below $78,000.
The cryptocurrency briefly fell towards $77,300, then surged towards $78,600 before giving up those gains.
Leveraged positions have added to the speed of the decline. Bitcoin futures open interest stood near $54.8 billion on Aug. 30, while roughly $390 million in crypto positions were liquidated over the past 24 hours, with long positions accounting for about 70% of the losses.
Institutional demand also weakened before the weekend.
US spot Bitcoin exchange-traded funds recorded $201.8 million in net outflows on Aug. 28 after receiving $314.4 million on Aug. 25, $232.1 million on Aug. 26 and $242.2 million on Aug. 27, according to SoSoValue data.
The funds remain at about $3.3 billion in net inflows for August despite Friday’s reversal.
BTC price analysis
Bitcoin’s daily chart shows price holding well above all four major exponential moving averages despite the retreat from $80,000.
Bitcoin was trading near $77,800 on the 2-hour chart, below its 20-period EMA at $78,207, 50-period EMA at $78,288, and 100-period EMA at $77,399, while remaining above the 200-period EMA at $74,572.
Bitcoin Technicals
The setup suggests that short-term momentum has weakened, with Bitcoin trading below the 20- and 50-period averages. However, the price remains above the 100- and 200-period EMAs, leaving the broader recovery structure intact for now.
A sustained break below the $77,400 area could expose Bitcoin to further downside toward the $74,600 200-period EMA. On the upside, a move back above the $78,200-$78,300 zone would bring the recent highs near $79,000-$80,000 into focus.
The Stochastic RSI has also retreated from overbought territory. The faster line is at 43.71, below the slower line at 46.56, indicating that near-term buying momentum has eased.
A renewed move above $78,300 could signal improving momentum, while a deeper Stochastic RSI decline would reinforce the risk of further consolidation or a pullback.
The bearish crossover shows that upside momentum has weakened while Bitcoin remains below $80,000.
The Directional Movement Index (DMI) is not currently showing a clear bearish trend. The positive directional indicator stands at 19.02, above the negative directional indicator at 15.40, while ADX is at 24.44.
The readings suggest that buyers retain a slight directional advantage, although the relatively narrow gap between the two directional indicators points to limited conviction.
Bitcoin’s inability to reclaim the $78,200-$78,300 area keeps that zone as an immediate resistance level. A sustained move above it could open the way toward $79,000 and the $80,000 psychological level.
On the downside, the 100-period EMA around $77,400 is an important near-term support level. A break below it could expose the $76,000-$77,000 region, with the 200-period EMA near $74,600 providing a deeper support level.
The Williams %R reading is around -66.11, indicating that Bitcoin has moved back toward the lower portion of its recent trading range but is not yet in oversold territory.
The indicator would need to fall below -80 to signal more pronounced oversold conditions.
A recovery in Williams %R alongside a move back above the $78,200-$78,300 EMA cluster would indicate improving short-term momentum. Conversely, a move below -80, combined with a break under the $77,400 support, could increase the risk of a deeper pullback toward $76,000 and potentially the 200-period EMA.
Nio stock has crashed in the past few months, erasing billions of dollars in value, even as its delivery growth has accelerated. It has now stalled at a crucial support level and has formed a highly bullish chart pattern ahead of its earnings report on Tuesday, September 1.
Nio stock in the spotlight after a major BYD earnings
Nio, a top Chinese EV company, will be in the spotlight this week as it releases its results, which are expected to show strong revenue growth.
Its recent delivery numbers showed that the company delivered 107,658 vehicles in the second quarter, up by nearly 50% from the same period last year. Its June deliveries rose by 62.9% to 40,597.
This growth continued into the third quarter as the company delivered 35,934 vehicles in July. Its July deliveries were up by 71% from the same period last year.
Therefore, Yahoo Finance data shows that analysts expect the upcoming earnings report will show that its revenue jumped by 75% to 33.28 billion yuan. In reality, chances are that its report will show that its revenue rose to over 35 billion yuan. Historically, the company tends to report stronger-than-expected revenue figures.
Investors will pay close attention to the company’s profitability metrics in this report. Its last report showed that its net loss stood at over $40 million in the first quarter, a big reversal after it made a profit in the fourth quarter. A profit or a smaller loss will be bullish for the stock.
Still, BYD, the biggest Chinese EV company, delivered a major warning in its earnings report last week. In a statement, the management said that the Chinese auto sector faced sluggish growth as the economy slows. It is also experiencing fierce competition and rising raw materials and chip costs that are affecting their margins.
Companies, including Nio, are offsetting the weaker domestic demand by boosting their exports. The top export markets are in the Southeast Asia region and Europe. Some companies have also started exporting to Canada, a country that slashed its EV tariffs.
Nio share price has formed a bullish pattern
Nio stock chart | Source: TradingView
Technicals suggest that Nio’s shares will continue falling after it releases its financial results this week. For one, it has remained below all moving averages, a sign that bears have prevailed.
The stock has also moved to the important support level of $4.37, its lowest level in February and March last year. A clear move below this level would be a sign that bears have prevailed, pointing to more downside.
On the other hand, the stock has formed a bullish divergence pattern as the Percentage Price Oscillator (PPO) has drifted upwards. The stock has also formed a falling wedge pattern, which is made up of two descending and converging trendlines. This pattern normally leads to a reversal.
Therefore, the stock may rebound after earnings as investors target the key resistance level of $5, its highest level on July 31.
BakerAvenue’s chief strategist King Lip views Broadcom Inc (AVGO) as a “top pick” heading into the chipmaker’s Q3 earnings scheduled to be released on September 2nd after market close.
Consensus is for AVGO to record $29.43 billion in revenue on $3.24 a share of earnings (EPS) – representing an 84.5% and 91.7% year-on-year growth on the top- and bottom-line.
Heading into the quarterly print, Broadcom stock is down over 25% versus its year-to-date high.
Lip’s constructive view on Broadcom Stock
Speaking recently with CNBC, King Lip pinpointed a fundamental shift underway within artificial intelligence infrastructure spending.
According to him, the market is evolving away from initial model development toward real-world application deployment.
“We see the tech trade as moving away from, you know, show me the model, if you would, to show me the money,” the strategist noted.
King Lip believes industry workloads are rapidly moving from AI training toward inference, where tailored chips execute dedicated, repetitive tasks at scale.
Within this second phase of hardware deployment, he sees AVGO stock holding distinct structural advantage over traditional GPU-focused market leaders.
Note that Broadcom does also pay a dividend yield of 0.71%, which makes it even more attractive as a long-term holding.
Why AVGO shares are attractive ahead of Q3 earnings
While Nvidia has dominated foundational model training, Broadcom Inc represents a key vehicle for custom application-specific integrated circuits (ASICs) and long-term inference demand.
“Nvidia has been great for training models, but for huge repetitive type workloads, AVGO is our top pick for the next evolution in custom AI chips and inference play,” Lip explained.
Crucially, Nvidia doesn’t really have to lose in order for Broadcom to win in the AI chips space – he added.
Investors should note, however, that AVGO shares currently sit below their major moving averages (MAs), indicating bears are firmly in control across multiple timeframes heading into its earnings event.
How Wall Street recommends playing Broadcom
While macro rate pressures and broader AI revenue quality remain industry-wide concerns, AVGO’s core thesis hinges on resolving physical execution bottlenecks and warding off emerging rivals.
King Lip emphasized that mounting political friction around data center construction, such as local power grid constraints and community moratoria, presents a major operational hurdle for hyperscale buildouts.
However, Broadcom’s dominance in high-efficiency networking silicon and custom ASICs gives it a direct path to capture demand as cloud giants seek lower-cost, tailored alternatives to generic GPUs.
As lower-cost open-source models gain traction, Broadcom stands uniquely positioned to monetize the transition toward targeted inference infrastructure without needing market share losses from GPU leaders to fuel its growth.
Note that Wall Street analysts remain bullish as ever heading into AVGO’s quarterly release. The consensus rating on Broadcom shares is set at Buy with a mean price target of $534, according to The Wall Street Journal.
Military clashes between the US and Iran resumed in the Middle East, with disruptions around the Strait of Hormuz affecting oil shipments.
US Central Command confirmed that the US had struck two rocket launchers on Iran’s Larak Island.
The attack was the first publicly acknowledged US strike on Iranian positions since late July. Iranian state media reported that Tehran had responded by attacking US bases in Jordan.
The renewed hostilities sent oil prices higher. West Texas Intermediate crude traded more than 3% higher at above $86 a barrel, while Brent crude futures rose more than 3% to above $91 a barrel.
Energy stocks benefited from the move in crude prices. Halliburton and Valero Energy rose 3.04% and 1.84%, respectively, in trading.
Higher oil prices could add to inflation concerns at a time when investors are already focused on the Federal Reserve’s next policy decision.
Rate hike bets rise ahead of jobs report
Markets have increased expectations for a September rate hike after Warsh indicated that the Federal Reserve could raise borrowing costs if inflation does not move toward its 2% target.
CME FedWatch data showed traders pricing in nearly a 60% chance of a September rate increase, up from 41.4% a week earlier.
The outlook has become more uncertain following mixed inflation data. July consumer inflation showed relatively mild price pressures, while the Personal Consumption Expenditures reading came in hotter than expected.
The August employment report, due September 4, will therefore be closely watched. Investors will also receive manufacturing and services data during the week.
Nvidia fell 0.31% while AMD gained 0.6%.
Wall Street heads into September after strong August
The decline in futures follows a strong month for major US indexes.
The Dow was up 2.1% month-to-date and on track for its fifth consecutive monthly advance. The S&P 500 and Nasdaq Composite were up about 3% and 4%, respectively, putting both on course for their first monthly gains since May.
Technology stocks led the August advance, with the S&P 500 technology sector gaining nearly 6%. Nvidia rose more than 8%, while Microsoft and Micron Technology gained 10% and 13%, respectively.
However, inflation concerns have contributed to volatility, with Treasury yields reaching multi-year highs during the month. Elevated long-term yields remain a concern for markets.
Elsewhere, most crypto stocks moved higher, with Bitcoin trading below $78,000.
GameStop gained 4.8% after announcing that it would use cash on hand for about 27% of a previously announced $1.4 billion debt exchange, avoiding additional share dilution.