
Archive

July 2026

Browsing

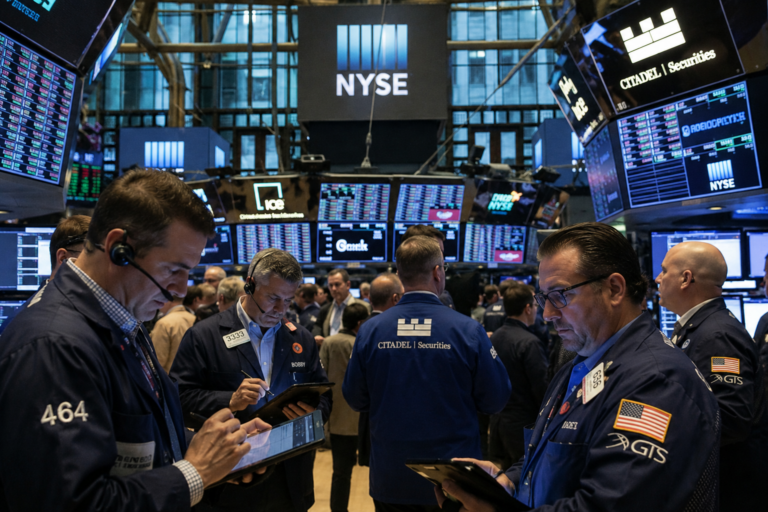
US stocks opened mixed on Friday, recovering modestly after Wall Street’s sharp selloff in the previous session, as investors assessed fresh corporate earnings, easing oil prices, escalating geopolitical tensions in the Middle East, and new tariffs announced by the Trump administration.

The Dow Jones Industrial Average rose about 40 points, while the S&P 500 gained around 0.13%.

The Nasdaq Composite fell 0.13%, continuing from Thursday’s losses.

The rebound came after the Dow fell more than 500 points, or around 1%, on Thursday, while the S&P 500 and Nasdaq Composite posted their steepest one-day declines in a month.

The selloff was driven by concerns over rising artificial intelligence spending following earnings from Alphabet and Tesla, alongside a surge in oil prices amid escalating Middle East tensions.

Intel shares fall despite good earnings

Intel reported second-quarter results that exceeded Wall Street expectations.

The chipmaker forecast quarterly revenue and profit above analyst estimates and outlined plans to increase spending over the next two years.

The company also reported revenue growth of 25%, marking its strongest quarterly revenue increase since the third quarter of 2011.

However, shares of Intel fell about 1.14% in trading.

The broader semiconductor sector remained subdued as investors continued to scrutinize AI-related spending across the technology industry.

Alphabet and Tesla’s latest quarterly results have heightened concerns over increasing capital expenditures and cash burn among major technology companies.

The cautious mood comes ahead of earnings reports next week from Microsoft, Amazon and Meta Platforms, which are expected to provide further insight into AI infrastructure spending.

Investors have become increasingly selective toward AI-related companies, rewarding operational execution while paying closer attention to profitability and returns on investment.

Oracle traded higher by 0.7% after the Pentagon announced a contract worth nearly $7 billion over as long as 10 years to consolidate the Defense Department’s on-premises software licenses under a single cloud agreement.

Middle East tensions and tariffs remain key market drivers

Markets continued to monitor geopolitical developments after President Donald Trump signaled that he is considering further military action against Iran following attacks by Yemen’s Houthi forces on two Saudi oil tankers in the Red Sea.

Oil prices, which climbed above $100 a barrel on Thursday for the first time since late May, eased on Friday. Brent crude traded near $97 per barrel, down roughly 3%, while US West Texas Intermediate crude slipped more than 2% to trade above $89 per barrel.

Although prices retreated, investors remain concerned that prolonged disruptions to global energy supplies could revive inflation pressures and complicate central bank policy decisions.

Separately, the Trump administration announced new tariffs ranging from 10% to 12.5% on goods from 60 trading partners, citing concerns over enforcement of forced-labor bans.

The measures took effect after a temporary 10% global tariff expired.

Investors turn attention to Fed meeting and economic data

Attention is now shifting toward next week’s Federal Reserve policy meeting and the release of the Personal Consumption Expenditures (PCE) price index, the central bank’s preferred inflation measure.

According to CME FedWatch data, markets are pricing in roughly a one-in-three probability of a Fed rate hike next week, compared with about a 12% chance a week earlier.

Despite Friday’s rebound in futures, the major US indexes remain on track for weekly losses, with the Dow heading toward a third consecutive weekly decline and both the S&P 500 and Nasdaq poised for a second straight week in the red.

The post Dow edges higher as Intel slips despite earnings, Nasdaq dips appeared first on Invezz
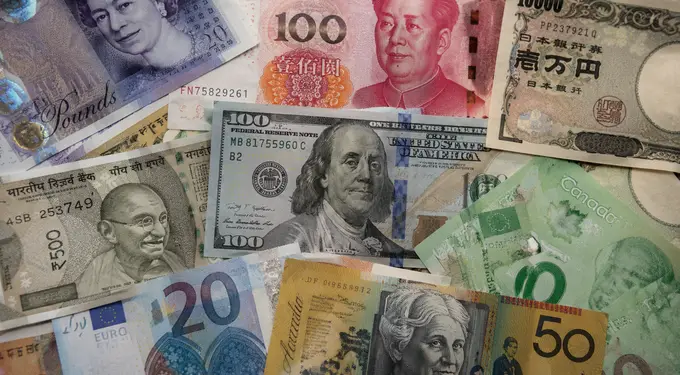
The Japanese yen remained under intense pressure today, July 23, as traders rushed to the US dollar amid the rising tensions in the Middle East. The USD/JPY pair was trading at 163.07, a few pips below this week’s high of 163.2. 

Japanese yen crash is continuing

The Japanese yen has continued falling this month, even as the country’s central bank has launched several defensive measures. 

The Bank of Japan has hiked interest rates to the highest level since 1995, and hinted that it may deliver more increases. 

At the same time, the bank has spent more than $73 billion on foreign exchange market interventions. While these interventions typically trigger a stronger yen, the gains have historically been short-lived.

The Japanese yen has mostly dropped because of the significant gap that exists between the US and Japanese interest rates.

Japanese rates have jumped to 1%, while in the United States, the Fed has left them unchanged between 3.50% and 3.75%.

Economists and traders now expect the Fed to hike rates further this year as inflation concerns remain. Odds of a Fed hike have jumped to over 67% on Polymarket.

Higher interest rates in the United States have made the US dollar more attractive than the Japanese yen.

They have also fueled the popularity of the USD/JPY pair among carry traders, who borrow in low-interest-rate currencies to invest in higher-yielding ones.

The ongoing crisis in the Middle East has contributed to the ongoing Japanese yen sell-off because the country depends substantially on oil coming from the region. In a statement, an Iranian official said that the crisis would escalate. He said:

“If the Americans target a bridge or a power plant in Iran, Iran will, in turn, strike infrastructure and bridges in the region, including energy facilities where the United States has interests.”

Data shows that Brent and the West Texas Intermediate (WTI) continued rising overnight as the crisis continued.

Also, Houthis hit an oil tanker attempting to cross the Bab El-Mandab Strait. Brent jumped to $96, while the West Texas Intermediate (WTI) approached the key resistance at $90. These events have fueled the US dollar gains as investors rush to its safety.

USD/JPY technical analysis

USD/JPY chart | Source: TradingView

The daily chart shows that the USD/JPY pair has continued rising in the past few months. These gains have been supported by the 50-day Exponential Moving Average (EMA). 

The pair has recently crossed the important resistance level of 162.82, its highest level on July 1. It also remains above the Supertrend indicator. 

Therefore, the path of the least resistance for the pair is bullish, with the next key level to watch being at 164. A move above that price may see it hit the resistance at 165 over time.

The post USD/JPY forecast: what next for the falling Japanese yen? appeared first on Invezz

Forex markets became cautious on Thursday as oil prices continued to rise due to growing tensions in the Middle East.

Investors are also focused on key central bank and economic events later in the day.

The European Central Bank is scheduled to announce its monetary policy decisions in the second half of the day.

The latest developments in the Middle East have added to concerns across financial markets.

US Stock futures fall as risk aversion builds

US stock index futures were trading lower, with losses ranging between 0.6% and 0.8%.

The declines came as investors assessed the latest geopolitical developments and their potential impact on financial markets.

The US Dollar (USD) Index, meanwhile, remained relatively stable.

The index was holding slightly above the 101.00 level at the time of press.

Euro holds above 1.1400 ahead of ECB decision

The euro remained relatively stable against the US dollar during early European trading on Thursday.

After posting marginal gains on Wednesday, EUR/USD held above 1.1400.

The pair was trading with limited movement as markets awaited the ECB’s monetary policy decision later in the day.

The ECB decision is expected to remain a key focus for currency markets.

Investors will be watching the central bank’s policy announcement as they assess the direction of the euro.

Pound struggles to build recovery momentum

GBP/USD also remained under pressure during Thursday’s European session.

The pair found a foothold and closed flat on Wednesday.

This came after it recorded significant losses for four consecutive days.

However, the pound struggled to build further recovery momentum on Thursday.

GBP/USD moved sideways below the 1.3400 level during the European session.

The pair’s movement reflected continued caution in the currency market.

Investors remained focused on broader market developments as risk sentiment weakened.

Yen weakens as USD/JPY climbs above 163.30

USD/JPY also remained in focus during Thursday’s session.

The pair’s correction proved short-lived on Wednesday.

USD/JPY recovered and ended the day virtually unchanged above 163.00.

The pair then gained traction during the European session on Thursday.

It traded at its highest level in about four decades, moving above 163.30.

Japanese Finance Minister Satsuki Katayama reiterated early Thursday that his government is “ready to take decisive action on foreign exchange as needed.”

The comments came as the Japanese yen remained under pressure against the US dollar.

The rise in USD/JPY kept attention on potential foreign-exchange market action by Japanese authorities.

Indian rupee edges higher against US dollar

The Indian Rupee (INR) opened marginally higher against the US Dollar (USD) on Thursday.

The move came amid possible intervention by the Reserve Bank of India (RBI) in the spot and non-deliverable forwards (NDFs) markets to support the currency.

The USD/INR pair edged lower to near 96.47 during the session.

However, the pair remained close to its two-month high of 96.75, which was recorded on Monday.

The rupee’s movement came as currency markets remained sensitive to developments in the US dollar and broader risk sentiment.

The possibility of RBI intervention also remained a factor in the pair’s trading activity.

Overall, financial markets remained cautious on Thursday as rising crude oil prices and escalating Middle East tensions weighed on risk appetite.

At the same time, investors awaited the ECB’s monetary policy decision and US Initial Jobless Claims data for further direction.

The post Forex markets turn cautious as oil surges on Middle East risks appeared first on Invezz

Pi Network has staged a notable recovery after falling to a fresh all-time low earlier this month, but the next phase of its price action may prove far more difficult.

At the time of writing, PI is trading at $0.09119, down 1.9% over the past 24 hours but still 10.7% higher over the last seven days.

The launch of Protocol v25 has given the Pi Network community a fresh catalyst, helping PI rebound from its recent lows.

Even so, persistent token unlocks, strong resistance at $0.10, and renewed security concerns continue to shape the outlook for the cryptocurrency.

Protocol v25 strengthens the network, but price still faces resistance

The release of Protocol v25 marks one of Pi Network’s most important technical upgrades in recent months.

The update introduces improvements designed to enhance network stability, strengthen privacy, and improve the platform’s readiness for developers building decentralised applications.

Among the most significant additions are support for BN254 cryptography and Poseidon hashing, two technologies commonly associated with privacy-preserving applications and zero-knowledge proof systems.

The update also includes improvements aimed at making the ecosystem more efficient as the network continues to mature.

https://twitter.com/openmainnet/status/2079715282600513887?s=20

While the upgrade has generated renewed optimism within the Pi community, the market has yet to deliver a decisive bullish confirmation.

PI recently recovered nearly 30% from its all-time low of $0.07059, recorded on July 14, 2026.

However, the rebound has slowed as the token approaches the psychologically important $0.10 level.

That price has become a key technical barrier. Previous recovery attempts have struggled to establish sustained trading above it, making it an important level to watch in the coming sessions.

A successful move beyond $0.10 could expose the next resistance around $0.12, while additional resistance sits near $0.135 and $0.15.

Token unlocks remain a major challenge

Although Protocol v25 has improved the project’s technical foundation, supply dynamics remain one of the biggest obstacles to a stronger recovery.

Over the next 30 days, approximately 127.5 million PI tokens are scheduled to be unlocked, averaging about 4.25 million PI per day.

Every unlock increases the amount of PI that holders can sell, creating additional pressure on the market.

For buyers to absorb that additional supply, demand needs to remain consistently strong. Otherwise, each wave of newly unlocked tokens has the potential to slow or reverse upward price momentum.

This supply overhang helps explain why many traders remain cautious despite the recent rebound from the July lows.

Technical indicators show improving momentum

Several technical indicators suggest that bearish pressure has eased compared with earlier this month, although they do not yet point to a confirmed breakout.

The Relative Strength Index (RSI) has moved back toward neutral territory after previously approaching oversold conditions.

That indicates selling pressure has moderated, but it does not yet signal a strong bullish trend.

The Moving Average Convergence Divergence (MACD), however, continues to reflect lingering bearish momentum, suggesting that buyers still need stronger follow-through before sentiment can shift decisively.

Other indicators paint a more constructive picture.

The Aroon Up indicator has strengthened while Aroon Down has weakened, a sign that buyers have regained some control after the recent decline.

Meanwhile, while the Supertrend indicator is yet to turn bullish, the Chaikin Money Flow (CMF) has moved into positive territory, pointing to improving capital inflows.

The Average Directional Index (ADX) also remains elevated, indicating that the current market trend is relatively strong, even if its long-term direction has yet to be fully established.

Taken together, these indicators suggest momentum has improved, but the market still needs confirmation through a sustained move above resistance.

Security concerns add another layer of uncertainty

Away from price action, Pi Network users are also paying close attention to wallet security after reports emerged from the community involving missing balances following token migration.

One Pioneer claimed that after a three-year lockup period ended, an attempted migration of 143 PI resulted in a wallet showing a zero balance alongside multiple failed transactions.

https://twitter.com/RizoWeb3/status/2078724108603515329?s=20

The report has not been confirmed as a network-wide issue, and there is currently no public evidence linking the incident to a flaw in the protocol itself.

The case nevertheless renewed calls within the community for stronger wallet protection, including mandatory two-factor authentication.

Pi Network has repeatedly warned users to remain cautious of phishing attempts, unofficial wallet tools, and anyone requesting recovery phrases or private keys.

As interest in PI increases following Protocol v25, scammers may also become more active, making wallet security an important issue for users.

The post Pi Network price forecast: Will Protocol v25 boost overcome token unlock pressure? appeared first on Invezz

HyroTrader, a crypto prop firm headquartered in Prague, has been named Best Prop Trading Firm at the CoinGape Web3 Innovation Awards 2026.

The recognition rewards the company’s exchange-connected funding model for digital asset traders and arrives as demand for funded trading accounts continues to climb across the crypto industry.

The CoinGape Web3 Innovation Awards honor organizations, products, and innovators shaping the future of Web3 across multiple categories.

Winners are decided by an independent judging panel featuring representatives from Polygon Labs, Visa, Beldex, Shirplink, and Liminal Custody.

HyroTrader was selected in the prop trading category on the strength of its direct exchange execution model, its risk management framework, and its consistent payout record.

Why crypto prop firms are drawing more traders

A crypto prop firm provides traders with access to the company’s capital once they pass a structured evaluation, usually called a challenge.

Instead of risking personal savings, a trader pays a one-time fee, proves they can hit a profit target while respecting drawdown limits, and then trades a funded account while keeping the majority of the profits.

For skilled traders, the model converts a large capital requirement into a small, defined cost.

That promise has pulled thousands of traders into funded trading, but it has also exposed the differences between operators.

Dozens of prop trading firms have disappeared in recent years, often after payout delays or sudden rule changes, and traders have responded by scrutinizing two things above all: how a firm executes trades and whether its payout claims can be independently confirmed.

Execution quality and verifiability, rather than headline profit splits, now separate the leading crypto prop trading operators from the rest.

Inside HyroTrader’s exchange-connected funding model

Execution is where the Prague company has staked its reputation.

Unlike providers that run evaluations on internal pricing systems, the HyroTrader prop firm routes trading activity to real exchange environments through a secure API connection to Bybit, an approach it pioneered in 2023 with the industry’s first direct exchange integration.

Funded traders operate on their own exchange accounts across more than 700 USDT perpetual pairs, filling orders in live order books rather than simulated feeds.

Traders who prefer a terminal can use the same model through Tealstreet or the CLEO app.

The rulebook is built for crypto’s 24/7 rhythm. The one-step evaluation carries a 10 percent profit target with a 4 percent daily drawdown and a 6 percent maximum loss, a minimum of five trading days, no time limit, and no stop-loss obligation.

Challenges start at $59, a $100,000 account costs $579, and the fee is refunded in full with the first payout. Profit splits start at 80 percent and scale to 90 percent without paid upgrades.

HyroTrader at a glance:

  • Founded in 2022, headquartered in Prague, Czech Republic
  • Funded accounts up to $200,000, with a scaling path to $1,000,000 for consistently profitable traders
  • More than 700 USDT perpetual pairs traded via Bybit API, Tealstreet, or CLEO
  • Profit split of 80 percent, scaling to 90 percent
  • On-demand payouts processed within 12 to 24 hours in USDT or USDC, verifiable on-chain
  • Over 1,700 funded traders, more than $5 million paid out, and a community of 35,000+ members

“This award reflects the standard we set for ourselves from day one: real exchange execution, clear rules, and payouts traders can verify,” said Samuel Drnda, CEO of HyroTrader.

“Recognition from a panel of this caliber confirms that transparency is not a marketing angle. It is the future of prop trading.”

Hyro Protocol brings prop trading on-chain

The award arrives as HyroTrader prepares a broader push toward verifiable trading infrastructure.

On July 8, the firm announced Hyro Protocol, an on-chain crypto prop trading protocol built on Solana that settles in USDC.

Hyro Protocol is designed to connect traders seeking capital with liquidity providers seeking exposure to verified trading strategies.

At its core sits a vault model: structured capital pools governed by smart-contract-enforced rules, with transparent accounting and on-chain performance records.

Traders can prove themselves through Challenge Vaults or, with an established track record, apply to manage liquidity provider capital directly through Direct Vaults.

Key protocol events, including vault creation, deposits, NAV updates, and payouts, are designed to be verifiable on-chain.

“Most prop firms still run on closed systems where rules can change mid-evaluation and payouts happen behind closed doors,” Drnda added.

“Hyro Protocol replaces trust with verification. Traders own their track records, LPs can check every number on a block explorer, and capital scales with performance instead of one company’s balance sheet.”

Trade execution will remain on professional exchange infrastructure while protocol state settles on-chain, a structure intended to preserve the liquidity and execution quality traders expect.

The company says it will publish program IDs, audit reports, and explorer links as each protocol component goes live.

What the award signals for funded trading

For the funded trading sector, the recognition of an exchange-connected, verification-focused operator points to where the category is heading.

As traders grow more selective, crypto prop firms able to prove their execution and payment records, rather than simply advertise them, are increasingly the ones setting the standard.

Funded trading involves evaluation fees and market risk, and nothing in this article constitutes investment advice.

The post HyroTrader named Best Crypto Prop Firm at Web3 Awards appeared first on Invezz

Oklo Inc. (OKLO) shares moved higher on Wednesday after a report said the advanced nuclear reactor developer is joining a Trump administration-led initiative designed to accelerate the development of new power plants to support the rapid expansion of artificial intelligence data centers.

According to a Bloomberg report citing a document it reviewed, Oklo and X-Energy will participate in a $200 million government program aimed at speeding up the deployment of power infrastructure needed to meet growing AI-related electricity demand.

The initiative also includes technology companies Microsoft and Nvidia and could be formally announced at an AI energy summit convened by the US Department of Energy.

Oklo shares rose as much as 5.9%, while X-Energy gained as much as 3.2% on Wednesday.

AI data center growth drives nuclear power push

The reported initiative comes as policymakers and technology companies seek solutions to rising electricity demand created by the rapid expansion of AI data centers.

According to Bloomberg, the program is intended to address concerns that the buildout of AI infrastructure has contributed to higher electricity prices across the United States.

Technology companies including Nvidia and OpenAI have previously identified energy availability as one of the biggest challenges to expanding AI adoption while maintaining the United States’ competitive position against China in artificial intelligence.

The Department of Energy is expected to use the initiative to accelerate the development of next-generation nuclear facilities capable of providing continuous, carbon-free electricity for large-scale AI computing infrastructure.

Bloomberg reported that several Department of Energy national laboratories, along with institutions including the University of Texas at Austin, are expected to share $60 million over a three-year period under the initiative.

Program targets faster nuclear plant development

According to the document reviewed by Bloomberg, one of the primary objectives of the initiative is to reduce the time required to design, license and construct new nuclear power plants.

The program also seeks to lower the staffing requirements needed to operate future facilities.

The Department of Energy estimates that approximately 300 gigawatts of new nuclear generating capacity will be required by 2050 to meet future electricity demand.

However, advanced nuclear reactors have not yet begun operating on a commercial scale.

Alongside this initiative, the Department of Energy has pursued other measures to support nuclear development, including plans to provide plutonium from Cold War-era nuclear weapons for use by commercial reactor developers.

AI investment reshapes US energy priorities

The latest effort reflects increasing attention from the US administration on ensuring sufficient energy infrastructure to support continued AI development.

Demand for electricity has accelerated after years of relatively flat growth, driven largely by the expansion of AI data centers requiring significant computing power.

The increasing strain on power markets and its effect on consumer electricity prices have also emerged as political issues ahead of the November midterm elections.

The reported initiative highlights the growing intersection between artificial intelligence, energy policy and advanced nuclear technology as governments and technology companies work to secure reliable sources of power for the next phase of AI infrastructure expansion.

The post Oklo stock jumps as firm joins $200M US AI nuclear power initiative appeared first on Invezz

Rocket Lab’s stock price jumped more than 3%  after the company secured a major contract from the U.S. government. RKLB climbed to $72.15, about 12% above its lowest level this month. The key question now is whether this rebound marks the start of a sustained rally or is simply another dead-cat bounce.

Rocket Lab wins a big US government order

RKLB stock jumped after the SpaceX competitor won a $266 million contract by the Department of War. This contract is for its suborbital launch services of 12 vehicles with six optional ones.

The order will be implemented at its the Pacific Spaceport Complex in Alaska and will be completed by December 2028

Rocket Lab has emerged as one of the fastest-growing companies in the space industry. In its last financial results, the company said that its revenue jumped by 63% to $200 million as its revenue backlog soared by 20% to $2.2 billion.

The company is benefiting from its Electron orders, which have continued rising in the past few months. It is also positioning in the hypersonic space, with its Hypersonic Accelerator Suborbital Test Electron (HASTE). This product will likely continue doing well as the US government continues to invest in hypersonic technology.

It is also seeing more orders of the Neutron platform, which is its medium-lift, reusable orbital rocket that will compete with SpaceX Falcon 9. It will be much bigger than Electron and will be reusable. It signed five new Neutron launches in the first quarter. 

Rocket Lab’s business is booming such that it received more orders in the first quarter of the year than it did in the whole of last year.

RKLB to publish its earnings soon

The next key catalyst for the RKLB stock will be released early next month. These earnings are expected to show that its business did well in the last quarter as its revenue soared. 

The average estimate is that its revenue rose by 59% to $230 million in the second quarter. For the year, analysts expect the revenue to come in at $918 million, up by 52% YoY. 

In addition to the organic growth, the company is also focusing on acquisitions. It acquired Mynaric, which provides laser optical communications, Motiv Space Systems, and most recently, it bought Iridium, its biggest buyout on record.

Analysts have a bullish outlook for the RKLB stock. The average estimate is that its stock will jump to $110, much higher than the current $71. Some of the most bullish analysts are from companies like Citizens, Craig Hallum, and Roth Capital.

READ MORE: Rocket Lab stock analysis: megaphone forms as experts remain optimistic

Rocket Lab stock price technical analysis

RKLB stock chart | Source: TradingView

The weekly chart shows that the RKLB stock has pulled back sharply in the past few weeks. It dropped from a high of $151 in May to the current $71. It remains above the 100-week Exponential Moving Average (EMA). 

The stock remains above the ascending trendline that connects the lowest swings in April, November, and July. It has always rebounded after hitting this support level.

It is also in the process of forming a harami candlestick pattern. Therefore, the stock will likely bounce back in the near term. If this happens, the next key level to watch will be the psychological level of $100.

The post Rocket Lab stock analysis: why it’s rising and what comes next appeared first on Invezz

DeXe (DEXE) has suffered one of the sharpest declines in the cryptocurrency market this year after its price plunged more than 80% on Wednesday.

The dramatic sell-off erased almost all of the gains from the token’s recent rally and left traders scrambling to understand what triggered the collapse.

While the broader crypto market remained relatively stable, DEXE dropped from trading above $23 during the day to around $4.83, marking an unusually severe move that quickly became one of the biggest talking points across the digital asset market.

The token is now trading more than 90% below that record level, with losses extending to 88% over the past seven days.

Notably, the collapse came only days after DEXE reached a new all-time high of $48.91 on July 13, highlighting just how quickly market sentiment changed.

Alleged team-linked token sales trigger market panic

The biggest catalyst behind the crash appears to be large token transfers linked to wallets reportedly associated with the DeXe project team.

According to on-chain data shared by blockchain analyst morsyxbt, wallets believed to be connected to the team transferred approximately 625,000 DEXE, valued at about $6.2 million at the time, to cryptocurrency exchange Binance on July 21.

The tokens were subsequently sold, adding significant selling pressure to a market that had already experienced a rapid price run-up.

The reported sales sparked immediate concern among traders, many of whom viewed the transfers as a sign that major holders were reducing their exposure.

Panic selling followed as market participants rushed to exit their positions, accelerating the decline within hours.

The speed of the drop stood out because it occurred while the broader cryptocurrency market showed no comparable weakness.

Instead of moving in line with Bitcoin or the wider altcoin market, DEXE experienced a sharp decline that appeared largely isolated to the token itself.

The crash also followed an extraordinary rally that had lifted DEXE from much lower levels to nearly $49 in a matter of days.

Such rapid gains often leave markets vulnerable when large holders begin selling, particularly when liquidity is relatively thin.

Liquidations magnified the decline

The initial wave of selling did not end with spot market activity. As prices continued falling, leveraged traders were forced out of their positions, creating another round of selling pressure.

Crypto market commentator Crypto__Haris reported that funding rates turned deeply negative as the decline intensified, while leveraged traders faced six-figure losses during the sell-off.

https://twitter.com/Crypto__Haris/status/2079657133793247577?s=20

Forced liquidations added to the downward momentum, creating a chain reaction that pushed the token even lower.

This type of liquidation cascade is common after strong rallies. When traders use borrowed funds to amplify gains, a sharp decline can trigger automatic liquidations.

Those liquidations become market sell orders, which place additional pressure on price and often lead to even more liquidations.

That sequence appeared to play out in DEXE’s case.

What began as heavy selling reportedly linked to large wallets quickly evolved into a broader market-wide exit as leveraged positions were unwound.

DEXE’s technical picture remains heavily bearish

The scale of the decline has left DEXE in an extremely oversold position from a technical perspective.

The token is down 80.2% over the past 24 hours, 84.3% over 14 days, 71.7% over the past month, and 40.3% over the past year.

Technical indicators also reflect the severity of the move.

DEXE token price analysis

The 7-period Relative Strength Index (RSI) reportedly fell to around 27.02, a level that typically signals heavily oversold conditions after aggressive selling.

However, despite the oversold reading, traders remain focused on whether selling pressure has fully subsided.

Market participants are also monitoring on-chain wallet activity for signs that additional large transfers to exchanges could emerge.

Current technical levels place immediate support between $4.00 and $4.50, where buyers may attempt to stabilise the price.

On the upside, analysts have identified $7.50 as an important resistance level that needs to be reclaimed before short-term sentiment begins to improve.

The post DEXE price crashes 80% in 24 hours as alleged team sell-off sparks panic appeared first on Invezz

Investors have largely shifted their attention away from the Magnificent 7 companies as enthusiasm has moved toward semiconductor stocks and the broader artificial intelligence trade. 

The Roundhill Magnificent 7 ETF (MAGS) has gained just 0.68% this year, significantly underperforming the S&P 500 and Nasdaq 100 indices. 

With earnings from the biggest names in technology approaching, the key question is whether this pullback presents a golden opportunity to buy these market leaders before a potential rebound.

Magnificent 7 stocks have underperformed the market

Magnificent 7 is a group made up of the biggest American companies, including popular names like Apple, Microsoft, Alphabet, Amazon, Meta Platforms, NVIDIA, and Tesla. Cumulatively, these companies are valued at over $22 trillion.

These companies have underperformed the broader market this year as investors have started to question their AI spending. At the same time, investors have turned to memory companies, with the popular DRAM ETF attracting over $20 billion in assets in less than four months.

Apple, which has plans to spend just $14.6 billion in capital expenditure this year, has jumped by 20% and is the best-performing Magnificent 7 company. Nvidia and Google have risen by 9%, while Amazon has risen by 7%. Meta has slipped by 2.8%, while Tesla is down by over 17%.

This performance has pushed investors to lose interest in these companies. The closely-watched Roundhill Magnificent 7 ETF (MAGS) has had over $167 million in outflows in the last six months. It has shed over $332 million in assets in the last three months.

MAGS ETF inflows and outflows | Source: ETF Db

Recently, however, there are signs that investors are buying the dip, with the net inflows rising by $400 million in the last 30 days. 

Magnificent 7 earnings ahead

The next few days will be crucial for Magnificent 7 companies as they publish their financial results. Tesla and Alphabet will be the first ones to publish their results today, with analysts expecting strong numbers.

Tesla recently announced strong second-quarter delivery numbers. It sold 480,000 vehicles in the second quarter after making 450k. A recent report suggested that the company is boosting its production in Germany as demand in Europe jumped. 

Estimates are that its revenue rose by 17.2% in the second quarter to $23 billion as its deliveries jumped.

Alphabet is also expected to release strong numbers. The average estimate is that its revenue jumped by 21% to $113.62 billion, while its EPS moved from $2.31 to $3.04. These will be the first results since the company raised billions of dollars by selling shares and debt. 

More Magnificent 7 companies will publish their numbers next week. Microsoft and Meta Platforms will release their results on Wednesday, while Apple and Amazon will do so a day later. Nvidia is always the last company to publish its numbers.

These results will be important because the big-tech companies will describe their strategies going forward. Most importantly, they will announce their capital expenditure plans as the cost of memory, servers, and chips keeps rising. 

Most analysts believe that most of these companies will do well over time. In a recent Bloomberg interview, Morgan Stanley’s Mike Wilson said that big tech stocks will do well as investors rotate from semiconductor names. 

Also, the average estimate for Nvidia stock is $304, much higher than the current $207. The consensus Microsoft target is $556, up from the current $397, while Google’s target is$386.

The post Magnificent 7 face the ultimate test as Q2 earnings loom appeared first on Invezz

GE Vernova GEV shares fell about 4% in premarket trading on Wednesday after the energy equipment maker narrowly missed Wall Street’s profit expectations.

The company also warned that global tariffs could increase its costs by as much as $200 million next year, overshadowing stronger revenue growth and another increase in its full-year outlook.

The company said tariffs are expected to raise costs by between $100 million and $200 million in 2026, even after accounting for contractual protections and cost recovery measures.

The warning came despite another quarter of robust order growth fueled by surging electricity demand linked to data center expansion and broader electrification trends.

The Cambridge, Massachusetts-based company reported adjusted core earnings of $1.3 billion for the second quarter, slightly below analysts’ expectations of $1.3 billion, according to LSEG data.

Adjusted earnings per share came in at $2.47, missing the analyst consensus estimate of $3.04.

Revenue rose 22% year over year to $11.1 billion, surpassing FactSet estimates of $10.8 billion.

Net profit increased to $649 million, or $2.47 per share, from $492 million, or $1.86 per share, in the same quarter last year.

Chief Executive Scott Strazik said GE Vernova continues to benefit from strong global demand, supported by a record backlog worth $176 billion.

In the second quarter, total orders climbed to $24.2 billion, nearly doubling from $12.4 billion a year earlier, with organic orders rising 88%, driven primarily by the Power and Electrification businesses.

Wind remains the weakest business

While demand for electricity infrastructure continued to strengthen, GE Vernova’s wind division remained a drag on overall performance.

Revenue from the Wind segment declined about 10% to $2 billion as lower onshore turbine deliveries and higher offshore project costs weighed on results.

The business reported a core operating loss of about $275 million, extending losses from the previous year.

By contrast, the Electrification segment generated core profit of $671 million, more than doubling from $314 million a year ago.

The Power business also posted strong performance, with core profit rising about 31% to $1 billion.

The contrasting results underscore the company’s increasing reliance on conventional power generation and grid infrastructure, areas benefiting from growing investment as utilities prepare for rising electricity demand.

Company raises outlook despite tariff warning

GE Vernova increased its financial guidance for the second consecutive quarter, citing accelerating investment in electricity generation and transmission.

The company now expects 2026 revenue of between $45.5 billion and $46.5 billion, approximately $1 billion higher than its previous forecast.

It also sharply raised its free cash flow outlook to between $11.5 billion and $12.5 billion, compared with its earlier projection of $6.5 billion to $7.5 billion.

The improved outlook reflects expectations that electricity consumption in the United States will continue rising as artificial intelligence infrastructure, data centers and broader electrification projects boost demand.

Commercial electricity demand is expected to outpace residential consumption over the coming year, creating additional opportunities for equipment suppliers.

Valuation debate continues

GE Vernova shares have climbed roughly 60% this year and have nearly doubled over the past 12 months, making the stock one of the strongest performers in the industrial sector.

Last month, Jefferies raised its price target on the company to $1,210 while maintaining a Buy rating. The shares currently trade around $1,079.

However, not all analysts believe the valuation is justified.

According to Simply Wall St, a discounted cash flow analysis values GE Vernova at around $874 per share, implying the stock trades at roughly a 23.5% premium to its estimated intrinsic value.

At the same time, valuation based on earnings multiples suggests the shares remain attractive relative to peers.

Analysts say the key question for investors will be whether GE Vernova can continue converting the global wave of investment in power generation and grid infrastructure into sustained earnings growth and stronger cash flows while managing rising costs and execution risks.

The post GE Vernova beats revenue estimates, raises 2026 outlook: why is the stock falling? appeared first on Invezz