Archive

July 2026

Browsing

The post Can Stablecoin Market Cap Reach $1 Trillion? What the Data Reveals appeared first on Coinpedia Fintech News

Stablecoins have evolved far beyond their original role as settlement assets for cryptocurrency trading. With the total stablecoin market exceeding $310 billion, growing institutional participation, record on-chain payment activity, and regulatory progress in major jurisdictions, several financial institutions now project the market could expand well beyond its current size over the next decade. Forecasts vary …

The US Dollar remained resilient against its major peers early Friday as investors continued to monitor developments in the Middle East and looked ahead to a fresh batch of US economic data.

Market participants are set to focus on the US economic calendar later in the day, which includes the June Export Price Index, Import Price Index, and Housing Starts data.

Investors will also watch the preliminary July Consumer Sentiment Index from the University of Michigan (UoM) for further clues on economic conditions.

Dollar recovers after two-day decline

The US Dollar regained momentum on Thursday after declining for two consecutive sessions.

The USD Index ended the day in positive territory, supported by stronger-than-expected Initial Jobless Claims data.

The stronger labor market data helped the greenback recover.

At the same time, increased risk aversion across global financial markets boosted demand for the US Dollar as a traditional safe-haven asset.

Early Friday, the USD Index held on to modest gains near the 100.80 level during the European session.

Middle East developments weigh on market sentiment

Investor sentiment remained cautious as geopolitical tensions continued to dominate market attention.

The United States carried out strikes for the sixth consecutive night, focusing on southern Iran.

According to Al Jazeera, officials in Bandar Abbas in southern Iran reported that civilian infrastructure, including power facilities and a train station, had been hit.

Separately, Reuters reported in an exclusive article published late Thursday that Iran had asked Yemen’s Houthi militia to remain prepared to close the Red Sea oil route if US strikes targeted Iranian power infrastructure.

The report highlighted a potential new threat to global energy supplies, contributing to the cautious mood across financial markets.

The geopolitical uncertainty prompted investors to reduce exposure to riskier assets.

Reflecting this shift, US stock index futures were down between 0.8% and 1.5% during the European morning session, pointing to a broader flight to safety.

Major currency pairs remain under pressure

The stronger US Dollar weighed on several major currencies.

The euro struggled to recover after Thursday’s decline, with the EUR/USD pair remaining below the 1.1450 mark during Friday’s European trading session.

The British pound also stayed under pressure.

GBP/USD extended its losses and moved toward 1.3450 after falling nearly 0.5% in the previous session.

Meanwhile, USD/JPY traded within a narrow range below 162.50.

Japan’s Finance Minister, Satsuki Katayama, reiterated on Friday that Japanese authorities stand ready to respond to currency movements whenever necessary.

Indian rupee edges higher

The Indian Rupee opened marginally stronger against the US Dollar as trading headed into the weekend.

The USD/INR pair slipped toward the 96.30 level as the Indian currency gained ground.

As reported by Reuters, the move followed intervention by the Reserve Bank of India, which supported the rupee despite the broader strength seen in the US dollar.

With geopolitical tensions continuing to shape investor sentiment, markets will closely monitor the upcoming US economic releases for additional direction.

The post US dollar holds firm as Middle East tensions support safe-haven demand appeared first on Invezz

The US Dollar traded in a narrow range at the start of the week, while major currency pairs showed limited movement.

Meanwhile, oil prices advanced amid the absence of any signs of de-escalation in the Middle East crisis.

The US Dollar (USD) Index fluctuated below the 101.00 level after posting a two-day rebound at the end of the previous week.

At the same time, US stock index futures traded little changed, indicating a cautious start to the trading week.

Oil prices gain on geopolitical concerns

Oil prices moved higher at the beginning of the week as the ongoing crisis in the Middle East continued to support energy markets.

There were no indications of a de-escalation in the conflict, keeping investors focused on potential supply risks.

During Asian trading hours, the People’s Bank of China (PBOC) announced that it kept its benchmark Loan Prime Rates (LPRs) unchanged.

The central bank left the one-year Loan Prime Rate at 3.00%, while the five-year reference rate remained at 3.50%.

Following the announcement, the Australian Dollar showed a limited reaction.

The AUD/USD pair traded relatively quietly on Monday and edged marginally higher during the session, remaining slightly below the 0.7000 mark.

New Zealand inflation data in focus

Investors are also awaiting New Zealand’s quarterly Consumer Price Index (CPI) data, which Statistics New Zealand is scheduled to release during the early Asian trading session on Tuesday.

Ahead of the inflation release, the New Zealand Dollar remained firm.

The NZD/USD pair held on to modest gains and traded near the 0.5850 level during the European morning session on Monday.

The euro and pound remain stable

The Euro traded with limited direction against the US Dollar at the start of the week.

The EUR/USD pair remained broadly flat during the day after opening with a small bearish gap.

It traded slightly below the 1.1450 level as investors refrained from taking significant positions.

The British Pound also posted modest gains against the US Dollar.

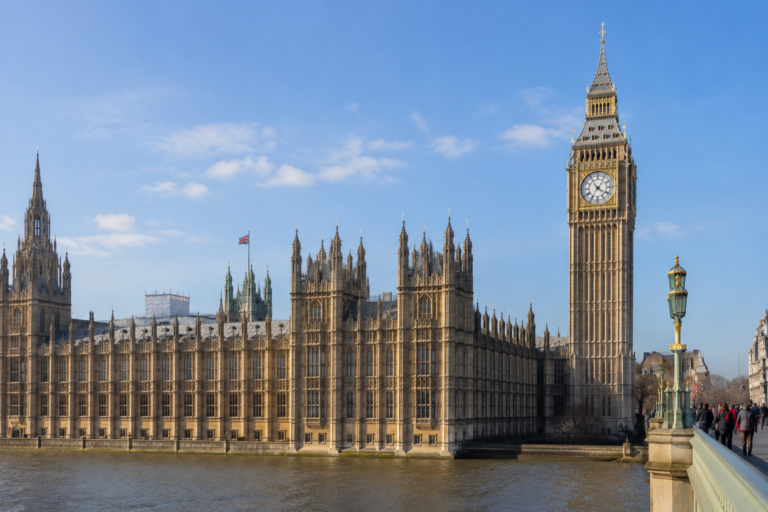
Market attention remained on political developments in the United Kingdom, with Andy Burnham set to become the country’s seventh Prime Minister in a decade later in the day.

Burnham is expected to appoint Shabana Mahmood as finance minister, with Mahmood widely viewed as someone who would support fiscal conservatism.

Against this backdrop, the GBP/USD pair held on to small gains and traded above the 1.3450 level at the start of the European session.

Indian rupee weakens as oil rises

The Indian Rupee opened the week on a weaker footing against the US Dollar.

The USD/INR pair climbed to around 96.46, supported by a fresh rise in oil prices and continued foreign fund outflows from the Indian equity market.

The combination of higher energy prices and sustained selling by foreign investors weighed on the Indian currency at the start of the week.

Overall, currency markets remained largely range-bound as investors assessed geopolitical developments, monitored central bank decisions, and awaited key inflation data from Canada and New Zealand for further direction.

The post Global currencies trade in narrow ranges as markets focus on inflation and oil appeared first on Invezz

Crude oil prices continued rising on Hyperliquid as investors reacted to the ongoing escalation between the US and Iran. Brent jumped to $88.7, with its 24-hour volume soaring to $59 million. West Texas Intermediate (WTI), the US benchmark, rose to $83.62, with the volume rising to $111.2 million.

Crude oil prices jump on US-Iran war escalation

Brent and WTI prices continued their recovery this weekend as the US-Iran war escalated. The US launched the eighth round of attacks against key Iranian assets, with officials hinting that more attacks will be likely. According to Axios, the US has sent more air refueling planes to Israel in preparation for more attacks.

The current phase of attacks seems to be more severe, with the US focusing on key civilian infrastructure projects like roads and bridges. Iran, on the other hand, has warned that it would no longer abide to the terms of the agreement made with the US.

It has also warned its Gulf neighbors of more sustained attacks in the coming weeks. It attacked a key desalination plant in Kuwait during the weekend, with officials warning that airports and other essential infrastructure projects will be hit. As a result, there are concerns that this is turning into a forever war.

https://www.youtube.com/watch?v=Vf9KDVzm5YY

US oil inventories have plunged

All this is happening at a time when analysts are warning that the buffers that prevented a more dramatic surge in oil prices in the first phase of the war were no longer there. A recent FT report cited Energy Aspect’s Amrita Sen, who warned that the roughly 400 million barrels of excess inventories at the start of the war have largely been depleted. She said:

“Now we have close to nothing.  complacency around Hormuz flows is being severely tested.”

Recent data from the US shows that oil inventories have continued falling. A report by the Energy Information Administration (EIA) showed that inventories fell by 1.7 million barrels in the previous week.

At the same time, ship tracking data shows that traffic through the Strait of Hormuz has continued to dwindle this month. Just ten ships were sailing through the Strait in the last 24 hours, with 444 of them waiting.

The worst part about all this is that there is no easy way out for the current phase of the war since the memorandum of understanding (MoU) signed three weeks ago has failed.

Iran will not have an incentive to restart talks with the US as the country has attacked it at least three times during negotiations. It did that in June last year, February, and now during the MoU. 

Iran will also have the incentive to prolong the war, and possibly close the Red Sea, a move that will dramatically reduce the amount of oil coming to the market. It has also warned that it will target Fujairah, another location where oil is still flowing to the market. 

Crude oil price technical analysis

Brent crude oil price chart | Source: TradingView

The four-hour chart shows that Brent crude oil price jumped to its highest level since June 12. It has soared by over 25% from its lowest level in June.

Most notably, it has moved above the bullish pennant pattern, which is made up of a vertical line and a symmetrical triangle. It also moved above the key resistance at $83.25, its highest point on June 17.

Oil has also formed a cup-and-handle pattern and moved above the 50-day Exponential Moving Average (EMA). Therefore, the price will likely continue soaring, potentially to the key resistance level of $100.

The post Brent and WTI crude oil prices target $100 as analysts warn of a forever war appeared first on Invezz

Tesla stock dropped to a crucial support level on Friday as traders waited for the upcoming earnings. It also retreated as Xpeng, a top Chinese rival, hinted that it was about to launch a new Model Y killer. TSLA dropped to $380, down by over 23% from its highest point this year.

Xpeng hints of a new Model Y killer

Xpeng, a top Chinese electric vehicle company worth over $12 billion, hinted that it was working on a new car that will take on Model Y in China and Europe. In a statement, the company’s co-founder said:

“I think we’re not far from beating Model Y. I really believe in that.”

The statement came after the company launched L03, its more affordable electric SUV that starts at about 35,600 euros. It launched this model simultaneously in China and Europe. It is a more affordable vehicle than Model Y, which starts at 39,990 euros.

Xpeng hopes that the new vehicle will help it supercharge its deliveries and stock. In a recent report, the company said that its deliveries stood at 40,126 vehicles in June and 103,295 in the second quarter. It delivered 34,611 vehicle in June and 103,181 vehicles in Q2 of last year.

Tesla has come under significant competition pressures in the past few years as Chinese companies have continued launching new models and gaining market share. Some of its top competitors are companies like BYD, SAIC, Nio, and Li Auto. 

Tesla earnings are coming up

The next key catalyst for the TSLA stock price will be the upcoming earnings report that comes out on Wednesday. 

Analysts expect these results to show that its revenue jumped in the second quarter after its strong deliveries. It produced 450,000 vehicles in the quarter and delivered 480k. This was a big turnaround after the company made 408k vehicles and delivered 358k.

One possible reason for the rebound is that gasoline prices jumped in the second quarter as the US-Iran war escalated. In most periods, a surge in gasoline prices pushes more people to buy EVs, which are often cheaper to maintain.

The average estimate among analysts is that the company’s revenue will come in at $26.36 billion, up by 17.20% YoY. For the year, analysts estimate that its revenue will jump by 10% to $104.5 billion.

In addition to the rising competition, the company is also seeing elevated costs, especially in the data center industry.

Tesla stock price technical analysis

TSLA stock chart | Source: TradingView

The daily chart shows that the TSLA stock price has slumped in the past few months, moving from a high of $498 to the current $380. It has recently dropped below the 50-day Exponential Moving Average (EMA).

The Percentage Price Oscillator (PPO) has moved below the zero line and is pointing downwards. Notably, it is hovering slightly above the ascending trendline that links the lowest swing since April last year.

Therefore, the most likely scenario is where the stock drops further, potentially to $350 after earnings. On the other hand, a rebound above $400 will point to more upside.

The post Tesla stock hits crucial support as Xpeng teases 'Model Y killer' ahead of earnings appeared first on Invezz

US stocks closed lower on Friday, capping a weak week for Wall Street as a deepening selloff in semiconductor stocks and renewed concerns over artificial intelligence spending weighed on investor sentiment.

The decline came despite a strong start to the second-quarter earnings season, with rising geopolitical tensions in the Middle East adding to market uncertainty.

The Dow Jones Industrial Average fell 394 points, or 0.75%, to close at 52,158.96.

The S&P 500 declined 1.01% to 7,457.78, while the Nasdaq Composite dropped 1.40% to 25,511.12.

For the week, the S&P 500 lost more than 1%, the Nasdaq fell over 2%, and the Dow slipped nearly 1%.

Semiconductor stocks lead market lower

Technology shares remained under pressure as investors continued to reassess the sustainability of the artificial intelligence investment boom that has fueled markets over the past year.

The VanEck Semiconductor ETF (SMH) fell more than 8% for the week, marking its third weekly decline in four weeks.

The Philadelphia Semiconductor Index recorded its steepest weekly loss in more than a year and has fallen nearly 18% so far in July, although it remains up about 65% year to date.

The latest pressure followed the launch of a new artificial intelligence model by Chinese startup Moonshot AI, which claimed its Kimi K3 model narrows the gap with leading offerings from US companies.

The announcement added to concerns that increasing competition could reduce future demand for advanced AI chips and moderate the pace of technology spending.

The weakness in chipmakers eventually spread across the broader market as investors trimmed exposure to AI-related stocks.

Netflix was also among the session’s notable decliners, falling more than 6% after its earnings outlook failed to reassure investors about the sustainability of its growth.

Uber Technologies also declined after announcing its planned acquisition of Germany’s Delivery Hero in a deal valued at nearly $15 billion.

Shares of Intuitive Surgical also moved lower after the company maintained its procedure-growth forecast while warning that insurance-plan changes may be delaying patient care.

Earnings remain strong despite market weakness

Although equity markets finished the week lower, the second-quarter earnings season has started on a positive note.

According to LSEG, 49 S&P 500 companies have reported results so far, with 90% exceeding analysts’ expectations.

Analysts now expect aggregate second-quarter S&P 500 earnings growth of 26%, up from projections of 19.2% at the beginning of April. Strong bank earnings earlier in the reporting season have helped lift overall expectations.

Economic data released on Friday presented a mixed picture.

Consumer sentiment improved to a five-month high in July, while industrial production edged up 0.1%. However, single-family housing starts and building permits both declined.

Middle East tensions lift energy stocks and oil prices

Investors also monitored escalating geopolitical tensions after the United States and Iran continued military strikes across the Middle East.

The renewed conflict has disrupted energy flows through the Strait of Hormuz, a key global oil shipping route, supporting higher crude prices.

US West Texas Intermediate crude traded above $81 per barrel, while Brent crude remained above $86.

The rise in oil prices helped energy stocks outperform the broader market, making the sector the strongest performer within the S&P 500 during Friday’s session.

The post Dow falls nearly 400 points as chip selloff deepens, Wall Street posts weekly loss appeared first on Invezz

Some of Wall Street’s fastest-growing companies are turning expansion into something more tangible: cash.

Nvidia, Micron Technology, CrowdStrike and Palo Alto Networks have each reported sharp increases in operating or free cash flow while management or analysts lifted profit forecasts.

That combination provides stronger confirmation than an earnings beat alone because cash is available for research, acquisitions, buybacks and protection against downturns.

The catch is valuation, as these are financially strengthening businesses, but their shares already assume continued execution, leaving investors exposed if AI infrastructure, memory pricing or cybersecurity demand slows.

Nvidia and Micron turn the AI boom into cash

Nvidia generated a record $50.3 billion of operating cash flow in its fiscal first quarter, up from $27.4 billion a year earlier.

Free cash flow reached about $48.6 billion, giving the chipmaker ample room to fund product development, secure supply and support an additional $80 billion share-repurchase authorisation.

Consensus fiscal 2027 earnings estimates subsequently rose 14%, to $9.34 a share from $8.18.

KeyBanc analyst John Vinh raised his Nvidia target to $330 from $310 and retained an Overweight rating.

Writing in a note, Vinh said the CUDA software stack created “significant barriers to entry” and expected the Vera Rubin ramp to begin in July despite a slight delay.

Micron offers a more cyclical but faster-accelerating cash story. Fiscal third-quarter operating cash flow reached $25.39 billion, versus $4.61 billion a year earlier, while free cash flow hit $18 billion.

FactSet now expects fiscal 2026 earnings near $73.20 a share.

Long-term customer agreements provide added visibility, but Micron remains exposed to memory pricing and the industry’s history of overbuilding.

CrowdStrike converts subscriptions into record cash flow

CrowdStrike’s fiscal first-quarter operating cash flow rose 54% to $590.9 million, while free cash flow increased nearly 68% to $468.5 million. Its free-cash-flow margin widened to 34% from 25%.

The cybersecurity company raised its fiscal 2027 adjusted earnings forecast to between $4.88 and $4.96 a share, from $4.78 to $4.90.

The improvement reflects the economics of its Falcon platform: customers can add identity, cloud and other security modules without CrowdStrike rebuilding its sales and infrastructure base for each product.

Morgan Stanley analysts said CrowdStrike still had room for further valuation expansion, while 22 brokerages raised targets after the quarter.

Yet the same report showed the stock trading at 138 times forward earnings.

That leaves little protection if annual recurring revenue, deal activity or cash conversion falls short of elevated expectations.

Palo Alto’s margins rise, but acquisitions cloud the picture

Palo Alto Networks generated $871 million of operating cash flow in its fiscal third quarter, up 39% from a year earlier.

Adjusted free cash flow climbed 57% to $910 million, while the trailing 12-month adjusted free-cash-flow margin expanded 4.3 percentage points to 38.5%.

Management raised fiscal 2026 adjusted earnings guidance to $3.77-$3.79 a share.

BTIG called Palo Alto its “top pick”, citing stronger momentum and larger contracts, while Wells Fargo raised its target to $420 and pointed to a “clear catalyst path.”

The platformisation strategy encourages customers to consolidate network, cloud, identity and AI-security tools with one provider, supporting recurring revenue and cash generation.

However, CyberArk and Chronosphere contributed $388 million of quarterly revenue, and adjusted cash flow excludes some acquisition-related costs.

The post Nvidia, Micron lead 4 cash-rich stocks with rising profit forecasts appeared first on Invezz

Wall Street’s biggest banks are proving that even geopolitical uncertainty and volatile markets can be highly profitable when trading desks stay busy and artificial intelligence fuels an unprecedented wave of capital raising.

The six largest US banks generated a combined $55 billion in second-quarter profits, comfortably exceeding analysts’ expectations as market volatility, record AI-related fundraising and a resurgence in investment banking produced one of the strongest quarters for the financial industry in years.

Even after excluding JPMorgan Chase’s one-off Visa and equity-related gains, the six banks still generated roughly $50.4 billion in profit during the quarter.

Every one of the six lenders exceeded Wall Street estimates on both earnings and revenue, driven largely by record trading activity and a sharp rebound in investment banking.

Trading desks deliver blockbuster quarter

Trading operations once again emerged as the biggest earnings driver as geopolitical tensions and energy market volatility kept investors actively repositioning portfolios.

Financial markets were shaken during the quarter by the conflict in the Middle East and disruptions to shipping through the Strait of Hormuz, while a spike in oil prices reignited inflation concerns and prompted investors to reassess expectations for Federal Reserve interest-rate cuts.

Those rapid swings translated into exceptional trading volumes across equities, currencies, commodities and fixed income.

Goldman Sachs led the industry with a record $7.42 billion in equities trading revenue, a 72% increase from a year earlier.

Fixed-income trading contributed another $4.59 billion, up 32%.

JPMorgan Chase generated $6 billion in equities revenue, an 86% jump from last year, while fixed-income trading remained steady at $6.1 billion, bringing total markets revenue to $12.1 billion.

Morgan Stanley also reported record equity trading revenue of $6.3 billion, up 69%, alongside $2.5 billion from fixed income.

Bank of America posted record equities trading revenue of $3.6 billion, up 70%, while fixed-income, currencies and commodities (FICC) revenue rose 9% to $3.5 billion.

Citigroup’s equities trading business climbed 45% to a record $2.3 billion, while fixed-income revenue increased 7% to $4.7 billion.

Although its trading franchise remains considerably smaller, Wells Fargo also benefited from heightened activity.

Markets revenue within its Corporate and Investment Banking division rose 24% to $2.21 billion, with equities trading alone increasing 64%.

Dealmaking powers investment banking recovery

The recovery in investment banking proved equally significant, with AI emerging as one of the biggest catalysts for capital markets activity.

Investment banking fees surged across all six banks as mergers and acquisitions, equity offerings and debt issuance accelerated during the quarter.

Goldman Sachs generated $3.4 billion in investment banking fees, up 55% year over year, supported by strong advisory work and record debt underwriting.

JPMorgan Chase reported $3.3 billion in fees, up 30% and its strongest investment banking quarter since 2021.

Morgan Stanley posted the fastest growth among its peers, with investment banking revenue jumping 58% to $2.44 billion.

Bank of America, Citigroup and Wells Fargo also recorded healthy increases in advisory and underwriting income.

According to Dealogic, global investment banking revenue climbed 24% during the first half of 2026 to $61.4 billion, driven by mega mergers, a vibrant IPO market and elevated trading volatility.

Among the quarter’s most lucrative transactions was SpaceX’s record-breaking $86 billion initial public offering in June, the largest IPO in US history.

The listing alone generated roughly $500 million in investment banking fees across participating firms, with Goldman Sachs serving as lead-left underwriter while JPMorgan, Bank of America, Citigroup and Wells Fargo participated as co-underwriters and advisers.

AI spending is creating a new financing cycle

Executives across Wall Street argued that artificial intelligence is creating opportunities extending far beyond technology companies themselves.

Banks are financing data centres, underwriting debt and equity offerings, advising on acquisitions and facilitating the enormous capital flows required to build AI infrastructure worldwide.

For example, Wells Fargo advised on NextEra Energy’s $67 billion acquisition of Dominion Energy and Apollo’s $35 billion financing package for AI company Anthropic.

Goldman Sachs CEO David Solomon described the investment wave as creating “a ripple effect” throughout the US economy by generating financing and trading opportunities across public and private markets.

“We are in the middle of an AI capex super cycle where there are demands on financing in every single financing instrument, in every region of the world and across every single industry,” Goldman Chief Financial Officer Denis Coleman said.

Wells Fargo banking analyst Mike Mayo said the AI investment cycle “reached a tipping point” during the second quarter, identifying Goldman Sachs, JPMorgan Chase and Morgan Stanley as the biggest beneficiaries.

Following the strong earnings reports, Mayo raised his price targets on both Goldman Sachs and JPMorgan.

Consumer lending remains resilient

While capital markets dominated the headlines, consumer banking also continued to support earnings despite persistent inflation pressures.

Banks reported relatively low delinquency rates, while expectations that interest rates will remain elevated for longer continued to support lending profitability.

Bank of America added one million new credit card accounts during the quarter as customers spent $266 billion on debit and credit cards, up 9% from a year earlier.

Wells Fargo reported a 33% increase in auto loan revenue, helped by higher balances and stronger loan originations.

Even as many households continued to face rising costs for essentials such as fuel and groceries, banks continued to benefit from healthy consumer spending and resilient credit quality.

Banks are also adopting AI internally

The AI boom is not only generating advisory and financing fees but is also reshaping banks’ own operations.

Lenders are increasingly deploying artificial intelligence to improve productivity, automate workflows and manage costs.

Bank of America disclosed that it now has more than 300 approved artificial intelligence and machine learning use cases across its business.

These include 114 live generative AI applications, with 34 already deployed at scale to improve workflow efficiency and frontline productivity.

The post The $55B quarter: how trading, AI, and dealmaking drove record earnings for Big Banks appeared first on Invezz

Andy Burnham will enter Downing Street on Monday with a promise that has eluded successive British prime ministers for more than a decade: reviving economic growth.

But unlike his predecessors, Burnham is betting that the answer does not lie in Whitehall.

Instead, the incoming Labour leader is proposing a sweeping transfer of power to Britain’s regions, arguing that local leaders—not central government—are best placed to unlock investment, rebuild industry and improve living standards.

His slogan, “Good growth in every postcode,” captures a strategy that prioritises devolution, public investment and regional development over short-term fiscal stimulus.

While economists broadly agree that the approach could strengthen Britain’s economy over time, many also caution that it is unlikely to deliver immediate gains for households facing a prolonged cost-of-living squeeze.

A decentralisation agenda at the heart of economic policy

Speaking after being confirmed as Labour leader at a special party conference on Friday, Burnham outlined an agenda centred on shifting power away from Westminster.

“We will take power back from Westminster and Whitehall and give it to the place you live,” he told delegates. “More power over life’s essentials so you can make them work better.”

He described the reforms as “the biggest change in our lifetimes to the way the country is run,” arguing that economic growth cannot continue to be directed solely from London.

“It is time for Whitehall to accept that growth cannot be ordered from the top down. Instead, it can only be nurtured from the bottom up,” Burnham said in a speech on June 29.

The centrepiece of the plan is the creation of a new “Number 10 North” office in Manchester, which would oversee the government’s decentralisation programme and help local authorities reform transport, housing, utilities and industrial policy.

Burnham also wants to extend devolution beyond England, offering Scotland, Wales and Northern Ireland greater opportunities to deepen their existing powers.

A long-term answer to Britain’s growth problem

Burnham inherits an economy that has struggled to regain momentum since the global financial crisis.

Britain’s gross domestic product per person has increased by only about 7% since early 2008, a sharp slowdown compared with the decade before the crisis.

More recently, official data showed the economy grew by just 0.1% in May after contracting by the same amount in April, underscoring how fragile the recovery remains.

Oxford Economics believes Burnham’s strategy reflects a structural rather than cyclical response to these challenges.

“Burnham’s economic strategy will likely focus on regional policy and public investment, aiming to address disparities in spending while promoting devolution. Although these measures may not yield immediate growth, they could lay the groundwork for long-term improvements in the UK economy,” the consultancy said.

Economists argue that local authorities often possess better information about labour markets, infrastructure needs and business investment than central government.

In a New York Times report, Diane Coyle, professor of public policy at the University of Cambridge, said regional officials are better positioned to understand what skills employers require and can tailor education and training accordingly.

Britain is “extraordinarily centralized,” said Coyle.

The OECD echoed that assessment this week, saying reducing Britain’s large regional productivity gaps could lift overall national growth by improving transport, employment and local economic participation.

Manufacturing and defence move back into focus

Beyond decentralisation, Burnham wants to rebuild Britain’s industrial base.

He has pledged to support domestic manufacturing in sectors including steel, defence, energy, farming and food production while reducing reliance on overseas suppliers.

Defence investment is expected to play a central role in that strategy, with Burnham arguing that military spending should also help regenerate industrial regions through domestic production.

He has also pledged to preserve Britain’s “sovereign manufacturing” capabilities and make it easier for UK firms to secure public-sector contracts.

The approach marks a shift toward using industrial policy alongside regional development to stimulate economic activity.

Housing and public services

Housing is another pillar of Burnham’s economic programme.

He has promised what he describes as the largest council house-building programme since the years immediately following the Second World War, using surplus public land to reduce construction costs.

Burnham has also endorsed a “Housing First” approach modelled on Finland, aiming to tackle homelessness alongside broader affordability challenges.

His longer-term plans include a 10-year strategy to reduce the cost of housing, energy, water and transport by placing these sectors under greater public oversight.

Rather than widespread nationalisation, economists expect the government to rely on tighter regulation and partnerships with private companies given fiscal constraints.

Danny Sriskandarajah, chief executive of the New Economics Foundation, believes the government will also need to introduce measures that provide faster relief.

The new administration will likely deliver “a few eye-catching measures to address the cost of living,” potentially targeting energy prices, rents or social housing, he said in the NYT report.

Tax reforms likely to remain targeted

Burnham has pledged to retain Labour’s fiscal rules, including balancing day-to-day spending with revenue and avoiding tax increases on working people.

Instead, he has proposed targeted reforms.

Among them are lower business rates for pubs and music venues, funded through higher taxes on large distribution warehouses used by online retailers such as Amazon.

He also wants to raise the threshold at which business rates begin, removing many small high street businesses from the tax altogether.

Another idea under consideration is a land-value tax, which could eventually replace stamp duty or council tax.

Business welcomes stability but wants engagement

Despite the emphasis on economic reform, sections of Britain’s corporate sector remain uneasy.

According to the Financial Times, several major businesses have struggled to establish regular communication with Burnham’s advisers before he enters office.

Executives reportedly fear the incoming administration is prioritising government restructuring and devolution ahead of business engagement.

Some business leaders also worry that the transition team lacks dedicated advisers responsible for liaising with industry on economic policy.

Whether Burnham can bridge that gap while delivering his decentralisation agenda may prove one of the defining tests of his premiership.

His strategy promises to reshape how Britain governs its economy.

The bigger question is whether it can finally deliver the sustained growth successive governments have failed to achieve.

The post Andy Burnham's economic blueprint: How the UK's next PM plans to drive growth appeared first on Invezz


As the second-quarter earnings season of 2026 approaches its most critical stretch, the global equity market finds itself at a pivotal crossroads.

For over two years, a relentless, AI-driven bull run has propelled mega-cap technology valuations to historically elevated levels.

However, the narrative on trading desks has undergone a fundamental shift. The era of rewarding companies simply for uttering the words “artificial intelligence” is officially over.

As Alphabet, Microsoft, Meta, Amazon, and Apple prepare to open their books between July 22nd  and July 30th, Wall Street is demanding concrete evidence of monetization.

Investors are no longer grading on a curve; they want to see the receipts.

Big tech earnings ahead: the $725 billion arms race

The defining metric of this entire reporting cycle will undoubtedly be capital expenditure (capex).

The sheer scale of infrastructure investments being deployed by the four major US hyperscalers – Amazon, Microsoft, Alphabet, and Meta – has reached eye-watering proportions.

According to updated consensus data, their combined capex guidance now sits at an unprecedented $725 billion for the current year, representing a staggering 77% increase from 2025.

2026 projected capex commitments:

Amazon: ~$200 billion

Microsoft: ~$190 billion

Alphabet: $180 billion – $190 billion

Meta Platforms: $125 billion – $145 billion

This staggering allocation of capital into graphics processing units (GPUs), power grids, and massive data center footprints has triggered intense anxiety among institutional allocators.

While this structural build-out serves as a massive secular tailwind for hardware providers like Nvidia (which won’t report its data center metrics until August 26), it places immense pressure on the software and cloud giants to prove this capital is yielding high-margin returns.

A guidance cut this week would signal weak underlying enterprise demand – while an unbacked increase in spending without a corresponding bump in revenue could spark a sharp margin-driven sell-off.

The reporting calendar: key dates and battlegrounds

The heavy lifting begins next week, with the market tightly focused on three specific reporting windows:

  • July 22, 2026 (Alphabet): Google’s parent company kicks off the gauntlet alongside Tesla. Alphabet’s Q1 results saw Google Cloud revenue expand by an astonishing 63% year-on-year to hit $20 billion, boasting a record 32.9% operating margin. Wall Street is looking for Q2 revenue to hit roughly $116.8 billion. The core focus will be whether Google Cloud can sustain its 63% growth crown or if aggressive new market entrants have begun eating into its enterprise pipeline.
  • July 29, 2026 (Microsoft & Meta): Microsoft will present its fiscal fourth-quarter results, where any print for Azure growth below 35% will likely be treated as a severe deceleration. Simultaneously, Meta will need to prove that its $125 billion+ capex is continuing to optimize its ad-targeting engine and drive top-line growth to offset the massive cash burn of its infrastructure layer.
  • July 30, 2026 (Amazon & Apple): Amazon is expected to print revenue near $196 billion, with the market hyper-focused on AWS margin expansion. Apple will report its fiscal third-quarter numbers with an estimated revenue of $108.9 billion. Apple presents a fascinating contrarian play; by leveraging an installed base of over 2.3 billion active devices to deploy “Apple Intelligence,” it is executing a capital-light AI strategy that insulates its margins from the data center spending war engulfing its peers.

Cloud growth: The ultimate litmus test

Because cloud infrastructure is where enterprise AI demand materializes first, the sequential and year-over-year growth rates of Azure, AWS, and Google Cloud will serve as the market’s ultimate truth mechanism.

Investors are highly attuned to the risk of a “margin squeeze” – a scenario in which heavy depreciation costs from newly built data centers kick in before corporate clients scale up their paid software seats and API usage.

A note of caution was already introduced to the broader tech sector following IBM’s earnings miss on July 14th, which triggered a sharp one-day decline.

While analysts isolated that specific event to hardware supply-chain timing rather than systemic weakness in macro AI demand, it illustrated just how fragile investor sentiment has become.

With valuations priced for perfection, the upcoming multi-day stretch will decide whether Big Tech’s massive architectural bets can sustain the next leg of the macroeconomic expansion, or if the market is due for a harsh reality check on the actual velocity of AI monetization.

The post Big tech earnings outlook: Wall Street demands receipts on $700B AI spree appeared first on Invezz