
Archive

September 2026

Browsing

Bitcoin price BTC has risen 2.3% over the past 24 hours to roughly $78,500, breaking above $78,000 as softer US employment figures, fresh spot ETF inflows, and lower Treasury yields have supported demand for BTC.

ADP reported that US private employers added 38,000 jobs in August, below market expectations of roughly 47,000 and the weakest increase in seven months. 

The reading has become the main catalyst behind Bitcoin’s move as traders reassess the likelihood of another Federal Reserve rate increase.

The probability of a 25 basis point rate rise at the Fed’s Sept. 15–16 meeting fell to roughly 62% from more than 67% a day earlier, according to CME FedWatch data.

Lower expectations for another increase in borrowing costs have coincided with Bitcoin moving from below $77,000 to above $78,000.

Friday’s US nonfarm payrolls report will provide the next major reading on the labour market. 

A second weak employment print could further change expectations around the September Fed decision.

US Treasury yields have also eased after recently weighing on risk assets. 

The 10 year Treasury yield fell roughly four basis points to 4.74%, while the two year yield dropped around six basis points to 4.32%. 

Reuters reported that global markets steadied as Treasury yields retreated from multi year highs and oil prices stabilised.

Institutional flows turned positive at the same time. US spot Bitcoin exchange-traded funds recorded approximately $101.15 million in net inflows on Sept. 2, reversing roughly $236.5 million in net outflows during the previous session.

BlackRock’s IBIT accounted for approximately $115.45 million of the daily inflows. 

Ethereum, Solana and XRP ETFs recorded net outflows during the same session, leaving Bitcoin as the main beneficiary of institutional crypto fund flows for the day.

Buyers also stepped in close to a cost basis tracked by Bitfinex analysts. Their estimate placed the average cost basis of active Bitcoin investors at approximately $76,350. 

BTC dropped to roughly $76,400 before recovering, putting the local low within around $50 of the estimated level.

Standard Chartered added another crypto-specific development on Sept. 3 by launching institutional spot Bitcoin and Ether trading in the UAE. 

The bank became the first global systemically important bank to offer the service in the country, giving eligible institutional clients access to deliverable BTC and ETH through its existing electronic trading infrastructure.

Clients can settle trades using a custodian of their choice, extending institutional access to Bitcoin through traditional banking infrastructure.

BTC price analysis

Bitcoin’s daily chart has moved sharply higher from the $60,000–$64,000 range established through June, July, and much of August, with the latest breakout carrying BTC above $76,000 before price reached the $78,000–$80,000 region. See below.

BTC/USD 1-day price chart. Source: TradingView.

BTC is now trading near $78,500 after encountering selling pressure below $80,000.

The Directional Movement Index supports the breakout but also shows why $80,000 remains important. 

The positive directional indicator stands at 33.69, comfortably above the negative directional indicator at 11.68, showing that buying pressure currently exceeds selling pressure. 

The ADX reading of 43.45 is well above 25, confirming that the current trend has considerable strength.

A daily close above $80,000 would clear the immediate psychological resistance and could put the May swing area around $81,500–$82,000 back in play. 

Failure to hold the breakout area would leave $76,000–$76,400 as an important support zone, close to the active investor cost basis identified by Bitfinex.

Chaikin Money Flow has climbed to 0.34, its strongest positive reading visible on the daily chart in months. 

A CMF reading substantially above zero means buying pressure has accompanied the price breakout, reducing the likelihood that the move above $76,000 has occurred on price momentum alone. 

If CMF begins falling towards zero while BTC remains unable to clear $80,000, the divergence would weaken the case for an immediate move towards $82,000.

The 4-hour chart shows BTC consolidating after its rapid move from roughly $64,000 into the upper $70,000s. See below.

BTC/USD 4-hour price chart. Source: TradingView.

Price has spent several sessions largely between $76,000 and $80,000, while repeated attempts to move through the upper end of the range have stalled.

The nine-period Rate of Change has returned to 1.38% after falling sharply from the double-digit reading recorded during the initial breakout. 

Momentum has therefore cooled from the first leg higher without turning negative. 

ROC moving decisively above its recent local peaks while BTC clears $80,000 would support a move towards $81,500–$82,000, while a fall below zero alongside a loss of $77,000 would increase the probability of a retest of $76,000–$76,400.

The Elder Ray Index is also positive at 83, after recovering from negative territory. 

Buyers have regained control on the 4-hour timeframe, although the current reading remains far below the spike recorded when Bitcoin initially broke above $70,000. 

A continued rise in the index alongside a break above $80,000 would confirm increasing buying pressure.

Meanwhile, Bitcoin’s 24-hour liquidation heatmap shows a dense concentration of leveraged positions around $78,800–$79,000, followed by liquidity around and above $80,000. See below.

BTC/USD 1-day price charts. Source: TradingView.

If BTC clears $79,000, liquidations in that region could help carry price towards the $80,000 level.

On the downside, another large liquidity concentration sits around $76,400–$76,800, overlapping with the active investor cost basis near $76,350. 

A rejection below $80,000 followed by a break under $77,000 could therefore pull BTC towards that zone, while a loss of $76,000 would expose the next chart support around $74,000–$75,000.

The post Can Bitcoin price reach $80,000 after its latest breakout? appeared first on Invezz

The Australian dollar held firm today, September 3rd, as investors adjusted their RBA and Federal Reserve expectations for the year. The AUD/USD pair was trading at 0.7165, a few points below the August high of 0.7207. 

RBA rate hike expectations rise

Traders are bracing for interest rate hikes from the Federal Reserve and the Reserve Bank of Australia (RBA) happening as soon as this month.

Polymarket gives the odds of RBA’s rate hike happening in September rose to 67%. These odds jumped after the US and Iran resumed their kinetic activity, which led to higher oil prices. 

Australia has also published strong macro numbers this week. An S&P Global report showed that the services PMI came in at 53.2 in August, higher than the expected 52.9. A PMI reading of 50 and above is usually a sign that a sector is growing. The composite PMI came in at 52.7, also higher than the expected 52.50.

Another report released on Wednesday showed that the Australian economy expanded by 2.1% in the second quarter, higher than the expected 1.8%. It grew by 0.4% in Q2 after growing by 0.3% in Q1 on a QoQ basis. 

This growth happened even as the Reserve Bank of Australia (RBA) became the most hawkish central banks this year. It has already delivered three rate hikes this year, with officials leaving the door open for more hikes.

A key concern is that Australia’s inflation has remained at an elevated level in the past few months. This trend will likely continue now that the US and Iran have restarted their kinetic activity, leading to higher energy prices. Brent, the global benchmark, rose to $95.68, while the West Texas Intermediate (WTI) rose to $91.

Odds of Fed rate hikes rising

The same situation is happening in the US, where odds that the Fed will hike rates this month have jumped to 55% on Polymarket. These odds soared after Kevin Warsh delivered a highly hawkish statement at the Jackson Hole Symposium.

In it, he hinted that the bank was concerned about the state of inflation, which has remained above the 2% target in the past five years.

Focus now shifts to the upcoming US nonfarm payrolls (NFP) report that will provide color on the labor market. Economists expect the data to show that the economy created over 80k jobs in August this year.

AUD/USD technical analysis

AUDUSD chart | Source: TradingView

The daily chart shows that the AUD/USD pair may be on the verge of a bearish reversal in the coming days. For one, it has formed a rising wedge pattern whose two lines are about to converge. 

Also, the two lines of the Percentage Price Oscillator (PPO) have made a bearish crossover, while the Relative Strength Index is pointing downwards.

Therefore, the most likely scenario is where the AUD/USD pair falls, potentially to the key support of 0.700.

The post AUD/USD signal: forecast as RBA and Fed rate hike odds rise appeared first on Invezz

The USD/JPY exchange rate dived to its lowest level in a month as the Japanese yen made a strong comeback. It dropped to 156.85, down over 4.40% from its year-high as investors predicted that the Bank of Japan (BoJ) will hike interest rates as soon as this month.

Polymarket odds of BoJ rate hikes are rising

Markets are expecting the Bank of Japan to hike interest rates in its September 18 meeting. A Polymarket event contract has a 97.5% probability of this hike happening.

These odds have jumped after recent statements by senior BoJ officials, including Governor Kazuo Ueda and Deputy Governor Ryozo Himino. They have hinted that the bank will be comfortable implementing another rate hike as inflation has held steady this year.

The most recent data showed that the Tokyo CPI jumped 1.9% in August from 1.8% in the previous month. It has been in a steady increase since bottoming at 1.3% in May this year.

This trend will continue in the foreseeable future since the US and Japan have restarted their war. Iran carried out strikes against key US allies like Kuwait and Bahrain, leading to higher crude oil prices. Brent has jumped to over $95, while the West Texas Intermediate (WTI) has moved to $91. 

Japan is highly exposed to the events in the oil market because it imports from the Middle East, including countries like Saudi Arabia, UAE, Kuwait, and Qatar. Rising oil prices mean that inflation will continue rising in the coming months.

The rising BoJ hike odds comes at a time when Japan’s bond yields have soared to the highest level in years. The ten-year yield rose to 3.03%, much higher than the year-to-date low of 2.045%.

Similarly, the 30-Year rose to 4.20% before falling to 4.068% today as the odds of BoJ rate hike rose.

The challenge for the Japanese yen, however, is that the Federal Reserve is also expected to hike interest rates in the coming meetings. Odds of the Fed hiking rates in September jumped to 60% on Polymarket.

A Fed and BoJ hike would leave the differential where it is today, making the Japanese yen a popular carry trade funding currency. A carry trade is a situation where investors borrow from a low-interest-rate currency and then invest it in a high-interest-rate one. 

The next important catalyst for the USD/JPY pair is the upcoming US nonfarm payrolls data. Economists expect the economy to have added between 50k and 80k jobs in August after shedding 23k a month earlier.

USD/JPY technical analysis 

USDJPY chart | Source: TradingView 

The daily chart shows that the USD/JPY crashed to a low of 156, its lowest level since August 7. This retreat happened after the pair formed a rising wedge pattern, which is made up of two ascending and converging trendlines. This pattern is one of the most common bearish reversal sign in technical analysis.

The wedge was part of bearish pennant pattern, which happens after an asset makes a big dive. It has now remained below the 50-day and 100-day Exponential Moving Averages (EMA).

Therefore, the pair will likely continue falling, potentially to the key support level at 155.25. A move below that support will point to more downside.

The post USD/JPY signal: forecast as Japanese yen surges amid BoJ rate hike bets appeared first on Invezz

Solowin Holdings has a stablecoin issuer licence, a seat in Hong Kong’s tokenized deposit pilot and no stablecoin.

Bahrain’s central bank granted the licence on June 3, the first under that country’s framework.

Three months on, no coin has been issued, and the company has not said publicly when one will be. Nor has either Hong Kong licensee, five months after being approved.

Thomas Zhu, a Solowin director and chief executive of its AlloyX subsidiary, put the Gulf choice down to demand rather than to difficulty elsewhere: the Middle East “holds substantial sovereign capital and treasury-management demand,” he told Invezz in written answers to questions, and “this underpins our footprint in Dubai and Bahrain.”

What the growth is made of

Revenue for the year to March 31 was $28.05 million, up 895% from a base of roughly $3 million.

About $22.2 million of it, or 79%, was AI infrastructure: cloud compute sold to enterprise customers, not stablecoins and not tokenization.

The company’s own investor deck puts total value tokenised at $52 million, against $848.8 million of assets under administration and $1.04 billion of stablecoin and fiat trading volume.

It also discloses that a small number of clients account for a substantial share of revenue. Zhu presents the AI side as deliberate rather than incidental: the company will “not train general-purpose large language models,” he said, but supply “the compliant capital layer, token layer and governance layer that enable AI to conduct actual financial transactions.”

Operating expenses were $40.14 million, on AI cloud bills, headcount, research and share-based pay, for a net loss of $13.29 million.

The company ended the year with $16.8 million of cash and equivalents, up from $3.84 million.

AXG closed on Tuesday at $2.22, near the low of a 52-week range running to $4.83, for a market capitalisation of about $429 million.

Institutional demand across the sector remains early. “Flows on chain are really thin,” Nic Roberts-Huntley, chief executive of Blueprint Finance, said on the On The Margin podcast.

“I think what we’ve asked a lot of like institutional finance people who sit in their traditional roles and have very, very fixed practices is to say, you must change fundamentally what you do to get exposure to something that is just a fraction of the size of what you have. That doesn’t make any sense whatsoever.”

The licence and the pilot seat

Solowin’s Hong Kong link is not the stablecoin regime but the tokenization one.

Solomon JFZ, its crypto-enabled brokerage, is listed in the HKMA’s own annex of participants in EnsembleTX, the pilot running real-value tokenized money market fund trades through 2026 alongside Standard Chartered, HSBC, Bank of China (Hong Kong), BlackRock and Franklin Templeton.

“We are honored that our Hong Kong-based crypto-enabled brokerage, Solomon JFZ, has been selected to participate in EnsembleTX,” Zhu said when it was named.

Hong Kong’s stablecoin register is a separate matter, and a closed one.

It has carried the same two names since April 10: HSBC and Anchorpoint Financial, a joint venture of Standard Chartered Bank (Hong Kong), HKT and Animoca Brands, both flagged as front-runners in March.

Thirty-six firms applied. The government told legislators in June that “the licensing threshold will remain high” and that “the overall number of licences will remain very limited.”

Neither Hong Kong licensee has shipped either. HSBC’s Hong Kong dollar coin is due in the second half of 2026, routed through PayMe and its mobile banking app, a base of 3.3 million users on day one.

Strong tokenization or weak

The distinction that decides what any of this is worth is what a token actually conveys.

“You own the token and the token is the asset, you own the asset. It’s different. It’s what we call title tokenization,” Chris Turner, co-founder of the impact investment platform Kula, said on the On The Margin podcast.

Most of the market does something weaker: “It’s giving a contractual exposure to the economic upside of that particular asset. But you don’t own the asset.”

Asked where the business is heading, Zhu described the strong version for Solowin’s platform, FERION, an offering that lets institutions issue tokenized assets “in a compliant manner and bridge on-chain transactions with off-chain legal recognition and redemption.”

He named the binding constraints as “cross-jurisdictional legal affirmation, custody and regulatory compliance,” which is a description of the same problem.

Solowin does not break out the legal structure behind the $52 million tokenised figure, and is not required to.

The nearest comparable is measurable. Libeara, the Standard Chartered-backed Singapore platform Solowin backed in April, now runs the eighth-largest book of tokenized US Treasury funds at $695.3 million, according to rwa.xyz.

The whole tokenized Treasury market is $15.87 billion and shrank 1.6% last month.

Licences are being rationed, vendors are numerous, and the money that would pay for either has not arrived in sufficient amounts.

The post Bahrain leads the Middle East stablecoin race, but where are the coins? appeared first on Invezz

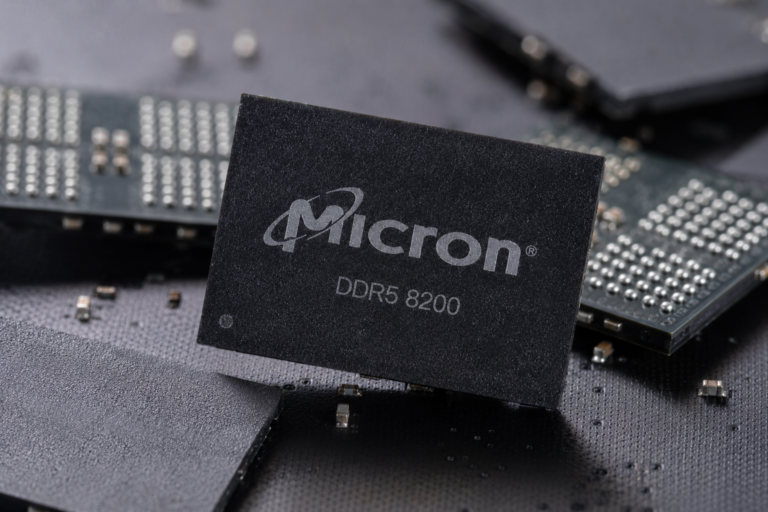
Micron stock has remained in a narrow range this week, continuing a trend that has been going on in the past few weeks. MU was trading at $956, down by 25% from its highest point this year. This article explores what to expect as the AI Bubble Index slips and its full-year earnings loom.

AI Bubble Index has dropped to a four-month low

The ongoing Micron stock weakness has coincided with that of other companies in the AI industry, including its top competitors like Samsung Electronics and SK Hynix.

Other top companies like Nvidia, AMD, and Intel have all pulled back in this period, even after publishing strong financial results, and the ongoing optimism that the AI business will continue doing well.

The main reason for this is the ongoing fear that the AI industry is in a bubble that will burst soon. Top pros, including popular analysts like Michael Burry and Ray Dalio, have all warned that the bubble will burst, drawing parallels with the dot-com bubble.

On the positive side, the closely watched AI Bubble Index has slumped to 48.4, the lowest level since April this year. This is an important metric that looks at several important gauges like valuations, market concentration, momentum and technicals, sentiment and hype, and systemic risk. 

For example, traditional metrics suggest that many companies in the AI industry are not all that overvalued. A good example of this is Micron whose forward price-to-earnings ratio has dropped to 12.7, much lower than the sector average of 22.40. It remains much lower than the five-year average of 74.

Micron earnings are nearing

A crucial catalyst that may drive the MU stock higher is its upcoming earnings, which will come out on September 30th. These numbers will provide more hints on whether its revenue and margins are growing. 

All signs are that the business is doing well. For example, earnings reports by top companies like Dell, HP Enterprise, and Nvidia suggest that spending is not slowing. 

The most recent results showed that its revenue growth continued growing in the third quarter. Its revenue jumped by 346% to $41.5 billion, its best performance ever.

The management hinted that the third quarter revenue will keep growing, with the fourth quarter revenue hitting $50 billion in the fourth quarter. If this happens, it will bring its annual $129.7 billion followed by $241 billion next year. Chances are that the revenue will come out better than expected.

This growth, and its profitability explain why many analysts believe that it has more upside, with the consensus price target rising to $1,295. Some of the most bullish analysts are from companies like DA Davidson, Wolfe Research, Raymond James, and Susquehanna.

Micron stock price technical analysis 

MU stock chart | Source: TradingView

The daily timeframe chart shows that the MU stock price bounced back after bottoming at $737 on July 29. It has now moved to $956, which is slightly above the 50-day Exponential Moving Average (EMA).

The stock has formed an inverted head-and-shoulders pattern, while the two lines of the Personal Consumption Expenditure (PCE) have crossed the zero line. Therefore, the most likely scenario is that the stock rebounds and hits the key resistance level of $1,250.

The post Micron stock analysis as the AI Bubble Index sinks to a four-month low  appeared first on Invezz

Investors have turned attention to the Schwab US Dividend ETF (SCHD) this year as it jumped to a record high, beating the benchmark funds tracking the Nasdaq 100 and S&P 500 indices. SCHD has jumped by 27% this year and is set to overtake the Vanguard Dividend Appreciation (VIG) fund.

Breakwave Tanker Shipping ETF is the best-performing fund this year

However, another smaller fund, known as the Breakwave Tanker Shipping ETF (BWET), is doing much better. It has jumped by over 1,718% this year, making it the best-performing fund in the United States. Its assets under management (AUM) has jumped to $119 million, while its expense ratio is a whopping 3.50%.

BWET has jumped because of the ongoing crisis in the Middle East that has pushd shipping prices to the highest level in years. This fund uses freight futures contracts to track movements in the tanker shipping rates. It does not invest in tanker companies.

READ MORE: SCHD nears title of biggest dividend ETF, but technical risks loom

BWET does that by investing in freight futures contracts of one-to-six months contracts, which have a weighted average expiration of between 60 and 90 days. 90% of these contracts are in Very Large Crude Carriers (VLCC), while the rest are on the Suezmax class.

Shipping prices have jumped sharply in the past few months, which has also helped push shipping companies to their record highs. A basket of 35 US and European-listed shipping stocks have soared by about 68% this year and 82% in the last 12 months. 

Shipping costs continued rising this week after the US and Iran restarted their kinetic activity. On Thursday morning, Iran announced that it had launched several missile and drones towards Kuwait, a major US ally. It did that to retaliate against the recent attacks.

The ongoing crisis has led to a plunge in traffic through the Strait of Hormuz, which accounts for about 20% of the global oil shipments. Many ships are currently trapped near the strait, with operators hiking prices.

This trend may continue in the foreseeable future, especially if the crisis between the two countries escalates. 

At the same time, the Russia-Ukraine war is continuing, with both sides targeting key shipping infrastructure. The two sides are expected to continue fighting now that negotiations have failed.

BWET ETF technical analysis

BWET ETF chart | Source: TradingView

The daily chart shows that the BWET ETF has soared in the past few months and is now hovering near its all-time high. It has remained above all moving averages and the Supertrend indicator. 

The risk, however, is that the fund is forming a double-top pattern at $483 and a neckline at $336. A double-top is one of the most common bearish reversal patterns in technical analysis.

Therefore, there is a risk that the fund will drop unless bulls push it above the key resistance level at $483. A clear break above that level will point to more gains towards $500.

The post Forget SCHD: Here’s why BWET ETF is up 1,720% this year appeared first on Invezz

US employers announced more than 52,000 planned job cuts in August, marking a sharp increase from July but remaining well below last year’s levels, according to Challenger, Gray & Christmas.

Companies announced 52,881 job cuts during the month, up 58% from the 33,429 cuts announced in July.

However, the figure was 38% lower than the 85,979 layoffs announced in August 2025 and represented the lowest August total since 2022.

Through the first eight months of the year, employers have announced 529,914 job cuts, down 41% from 892,362 during the same period last year.

Excluding government-related cuts, the decline is smaller, with 507,685 announced layoffs compared with 597,089 through August 2025, a decrease of about 15%.

The figures suggest that while companies are continuing to restructure their workforces, the labor market has not entered a broad-based wave of layoffs.

“This is the quietest August since 2022, but is generally on average for the month since the mid-2010s. What we’d like to see with low layoffs is an increase in hiring activity. While companies are making plans to hire more workers than last year, according to our numbers, it doesn’t appear those positions are being filled quickly,” said Andy Challenger, workplace expert and chief revenue officer of Challenger, Gray & Christmas.

A report by the Labor Department’s Bureau of Labor Statistics on Tuesday hinted at a similar phenomenon.

Job openings, a measure of labor demand, rose by 89,000 to 7.271 million on the last day of July, but the increase in available jobs did not translate into stronger hiring.

The number of hires fell by 278,000 to 5.054 million, while the hiring rate declined to 3.2% from 3.4%.

That distinction is becoming increasingly important.

Technology continues to lead job cuts

Technology remains the largest source of announced layoffs this year, despite recording its lowest monthly total of 2026 in August.

Technology companies announced 6,103 cuts last month, taking the sector’s year-to-date total to 155,126.

That is 52% higher than the 102,239 cuts announced by technology companies during the first eight months of 2025.

The sector now accounts for 29% of all job cuts announced this year.

The layoffs come as technology companies continue to reorganize around artificial intelligence, cloud computing and changing consumer demand.

In the latest in this series, Uber is laying off 3,300 workers globally.

Microsoft announced in July that it would eliminate about 4,800 jobs globally after earlier offering voluntary buyouts to roughly 9,000 US employees.

Apple has also reportedly cut close to 150 positions, largely at its Cupertino headquarters, while TikTok’s US joint venture closed its Nashville office last month and laid off 250 employees, according to labor documents filed with Tennessee.

Oracle has also been reported to be preparing additional job cuts globally.

The pattern suggests that technology companies are not necessarily cutting because demand has collapsed.

Instead, many are reshaping their organizations and reallocating resources toward areas expected to deliver stronger growth.

AI layoffs fall sharply in August

Artificial intelligence was no longer the biggest reason cited for job cuts in August, ending a five-month run.

Companies attributed 3,462 job cuts to AI during the month, the lowest monthly figure since December 2025, when 142 cuts were linked to the technology.

AI had been the leading cited reason for layoffs every month from March through July.

Despite the August decline, AI remains the biggest cited reason for layoffs on a year-to-date basis, with 116,175 announced cuts, representing roughly 22% of all job cuts.

Restructuring was the leading reason in August, accounting for 16,173 announced cuts, or 31% of the monthly total.

Market and economic conditions followed with 15,260 cuts, while company closings accounted for 6,743.

The shift away from AI as the top monthly reason could indicate that the initial wave of workforce reductions associated with automation and AI adoption is becoming less concentrated, although the year-to-date figures show that AI remains a significant driver of workforce restructuring.

Consumer products and food companies face pressure

Consumer products led all industries in August with 10,057 announced cuts, its heaviest month of the year.

Layoffs at Procter & Gamble and Estée Lauder contributed to the increase.

The sector has announced 28,574 cuts so far this year, down 20% from the 35,641 announced through August 2025.

Food producers announced another 7,982 cuts in August, taking their 2026 total to 22,367.

That represents a 75% increase from the 12,761 cuts announced in the sector during the same period last year.

Tyson accounted for nearly one-third of August’s food-sector cuts, with the company citing pressures linked to a historic cattle shortage.

Financial companies announced 4,286 cuts in August and 22,912 for the year, down 49% from the same period in 2025.

Media recorded only 480 cuts in August, the lowest monthly total among the industries tracked by Challenger.

But the picture within media was less positive for news organizations.

News companies announced 416 cuts in August, the highest monthly total since May 2025.

That was up 222% from the 129 cuts announced in August last year. News-sector cuts have reached 1,727 so far this year, 12% above the comparable 2025 figure.

Hiring remains the missing piece

The biggest concern in the Challenger report is not necessarily the level of layoffs but the pace of hiring.

Employers announced plans to hire 12,325 workers in August, down 23% from July’s 16,095 but 725% higher than the unusually low 1,494 plans announced in August 2025.

It was the strongest August hiring total since 2022.

Through August, companies have announced plans to hire 119,825 workers, up 37% from 87,626 during the same period last year. It is also the strongest January-to-August total since 2023.

Aerospace and defense companies led August hiring plans with 4,025 announced positions, followed by technology with 2,520 and industrial goods with 1,856.

Technology leads the year-to-date hiring tally with 19,751 planned positions, followed by aerospace and defense at 16,541 and automotive at 14,937.

“Employers are making plans to add workers, with 46% of those plans coming from manufacturing industries. The questions are how long will it take employers to actually fill these roles and will they find workers with the requisite skills,” said Challenger.

That gap between hiring plans and actual hiring could become a defining feature of the labor market in the months ahead.

ADP report reinforces signs of cooling

A separate report from ADP on Wednesday provided another indication that hiring momentum is weakening.

Private-sector employers added 38,000 jobs in August, according to ADP, down from an upwardly revised 46,000 in July and well below the 47,000 economists polled by Dow Jones had expected.

The increase was the smallest since January.

Healthcare continued to account for a substantial portion of employment growth, highlighting how concentrated hiring has become.

The ADP data suggest that companies are still adding workers, but broad-based demand for labor is becoming less evident.

The combination of modest payroll gains, limited layoffs and weaker hiring is consistent with a labor market that is cooling rather than collapsing.

Steady labor demand combined with limited layoffs are “consistent with full employment,” Fed Chairman Kevin Warsh said Friday at the US central bank’s annual conference in Wyoming.

The stable job market has fueled consumer spending and allowed the broader economy to forge ahead.

Friday’s payrolls report takes center stage

The Challenger and ADP reports arrive ahead of Friday’s closely watched nonfarm payrolls report from the Bureau of Labor Statistics.

Economists expect payrolls to increase by about 55,000 in August after an unexpected decline in July. The unemployment rate is expected to remain at 4.1%.

A result close to that forecast would reinforce the picture emerging from the private-sector data: employment growth is slowing, but the labor market remains relatively stable.

The post US layoffs jump 58% in August over July, but remain lowest for the month since 2022 appeared first on Invezz

US stocks opened higher on Thursday even as investors assessed mixed corporate earnings, rising oil prices and renewed tensions between the United States and Iran.

The Dow Jones Industrial Average climbed 392 points. The S&P 500 gained 0.53% while the Nasdaq Composite was up 0.63%.

Investors remained focused on developments in the Middle East as continued military exchanges between the US and Iran raised concerns about energy supplies and inflation.

Brent crude futures rose 1.22% Thursday, extending their gains to a fourth consecutive session.

Oil prices keep inflation concerns in focus

Higher crude prices have added to concerns that prolonged conflict in the Middle East could intensify inflation pressures and increase the likelihood of higher interest rates.

West Texas Intermediate crude futures traded about 1% higher near $92 a barrel, while Brent futures advanced to above $96.

Rising energy prices have recently contributed to upward pressure on Treasury yields as investors assess the potential impact on inflation.

The market is also watching developments around the Federal Reserve.

Traders have sharply increased expectations for a September rate hike over the past week, although those expectations eased Thursday following comments from Fed Governor Christopher Waller indicating support for keeping rates unchanged if upcoming inflation data does not surprise.

Fed funds futures showed a 54.6% probability of a rate increase at the September meeting, down from 63.2% a day earlier.

The benchmark 10-year Treasury yield was around 4.75% Thursday after briefly reaching 4.818% Wednesday, its highest level since November 2023.

The 2-year Treasury yield also reached its highest level since January 2025 during Wednesday’s session.

Broadcom slides while Snowflake surges

Corporate earnings provided mixed signals for investors. Broadcom shares fell about 5.6% in trading after the semiconductor company issued a fourth-quarter revenue forecast that fell short of Wall Street expectations.

The results highlighted the high expectations surrounding companies at the center of the artificial intelligence investment cycle.

Snowflake, however, offered a stronger earnings signal. Its shares surged more than 21% in trading after the software company reported better-than-expected second-quarter earnings and revenue and issued strong guidance.

Other software stocks also moved higher, with ServiceNow gaining 6.11%, while Salesforce and Adobe advanced about 3.14% and 3.7%, respectively.

The contrasting reactions to Broadcom and Snowflake added to the uneven tone across technology stocks as investors continued to assess whether AI-related spending can support elevated expectations.

Jobs data next as markets weigh September risks

Investors are now turning toward Friday’s US jobs report for further clues about the economy and the Federal Reserve’s policy path.

However, expectations for the data are being tempered by the central bank’s continued focus on inflation.

A prolonged Middle East conflict could further complicate the outlook if higher energy prices add to inflationary pressure.

The Japanese yen also strengthened sharply against the US dollar Thursday, rising more than 1% to around 156.1 yen per dollar.

The yen’s advance contributed to a broader decline in global bond yields.

Wall Street entered Thursday’s session after the major US indexes ended three-day losing streaks in the previous session.

Despite that recovery, September has historically been a weak month for equities. Nine of the 40 largest one-day declines in S&P 500 history occurred during September.

The post Dow rises 390 pts as US stocks gain despite oil, Fed and Iran concerns appeared first on Invezz

The NZD/USD exchange rate continued its strong downward trend, reaching its lowest level since August 13 this year after the Reserve Bank of New Zealand (RBNZ) delivered its interest rate decision. It slumped to 0.5835, down by over 2.6% from its highest point in August.

RBNZ interest rate hike

New Zealand’s RBNZ decided to hike interest rates for the second consecutive meeting as it fights to lower inflation, which has remained above the 2% level in the past few years. 

It brought the benchmark interest rate to 2.75%, narrowing the gap with the benchmark US interest rate, which stands between 3.50% and 3.75%. 

In a statement, the RBNZ maintained that inflation is a major issue in the country, with the headline Consumer Price Index (CPI) rising to 4.1% in the June qyuarter, driven by elevated crude oil prices.

While core inflation remains high, officials expect that it will come down to the target range sometime in 2027. The statement added:

“Resilient demand from New Zealand’s trading partners and strong export prices are supporting income growth and investment in export-exposed sectors and regional New Zealand.”

Still, the bank warned that the economy is seeing weak income growth, job insecurity, and flat house prices, which are having an impact on household spending and residential investment in Auckland and Wellington.

A key challenge is that inflation may remain at an elevated level in the coming weeks now that the US and Iran have resumed their kinetic activity. Brent and the West Texas Intermediate (WTI) have continued rising and now sits at $95 and $90, respectively. 

The crisis will likely escalate in the coming days, which will push crude oil and transportation prices substantially in the coming weeks.

This is one key reasons why New Zealand’s and US bond yields have continued rising. The ten-year yield jumped to 4.86%, its highest level since March 23rd this year. It has risen substantially from the June low of 4.358%. 

The same is happening in the United States, where the ten-year and 30-year rose to 4.8% and 5.28%, respectively. These yields have jumped as investors expect that the Fed will hike interest rates as soon as this month. 

NZD/USD technical analysis

NZDUSD chart | Source: TradingView

The daily chart shows that the NZD/USD pair peaked at 0.5990 in August. This was an important level since it was its highest point in May and June this year. 

The pair has now slumped and moved below the ascending trendline that connects the lowest swings since June, July, and August this year. Moving below that level confirmed the bearish breakout. 

The pair has moved below the Major S/R pivot point of 0.5860, and the 50-day moving average. Therefore, the pair will likely remain under pressure in the coming days, potentially to the strong, pivot, reverse level of the Murrey Math Lines too.

The post NZD/USD signal: forecast as RBNZ hikes rates as New Zealand bond yields jump appeared first on Invezz

Tesla stock TSLA fell 3% on Tuesday, giving back part of its 5.5% gain from the previous session as investors reassessed the company’s robo-taxi prospects and digested mixed vehicle registration data from Europe.

Tesla shares were down 3.1% during Tuesday’s session, compared with declines of about 0.5% for both the S&P 500 and Dow Jones Industrial Average.

The stock’s Monday rally was widely linked to renewed optimism around Tesla’s self-driving taxi business. However, investors remain focused on whether the company can scale its robo-taxi operations meaningfully enough to justify the enthusiasm surrounding autonomous driving.

Robo-taxi ambitions face scaling questions

Tesla launched its robo-taxi service in Austin, Texas, in June 2025 and has since expanded operations to several cities, including Miami and Dallas. However, growth has remained relatively slow.

Gary Black, co-founder of Future Fund, estimated that Tesla’s robo-taxi fleet consists of about 100 vehicles. That compares with an estimated fleet of nearly 4,000 vehicles operated by Alphabet’s Waymo across more than a dozen US cities.

Black described Monday’s rally as Tesla bulls getting ahead of themselves, highlighting the gap between expectations and the current scale of Tesla’s robo-taxi operations. 

Tesla’s shares remain only a few dollars above their level in late June 2025, shortly after the robo-taxi launch, despite the recent gains. This indicates that investors are still waiting for the business to expand substantially.

Competition in the autonomous ride-hailing market is also increasing. 

Amazon’s Zoox is offering robo-taxi rides, while Waymo has expanded its presence and is promoting its service through advertising.

Investors weigh autonomous driving valuation

The potential size and profitability of the robo-taxi market remain uncertain. 

Tesla is competing against established and emerging players, making it difficult to determine which company will capture the largest share of the market.

The economics of autonomous ride-hailing are another key consideration for investors. 

Morgan Stanley values Tesla’s autonomous driving technologies at roughly $1 trillion, around six times the value it places on the company’s traditional car business.

That valuation highlights the importance of Tesla’s self-driving ambitions to its broader investment case and helps explain why developments around the robo-taxi business can influence the stock.

Tesla Europe sales show mixed picture

Tesla’s August vehicle registrations across several European markets provided a mixed picture. 

Registrations, which serve as a proxy for sales, increased 279% year over year in France and 104% in Denmark, according to industry data.

However, registrations declined 79% in Norway and Spain, 41% in Sweden, 37% in Portugal and 36% in Italy.

Rico Luman, senior economist at ING Research, said France and Denmark benefited from increasing electric vehicle adoption and Tesla’s more affordable pricing. 

Matthias Schmidt, a European auto market analyst at Schmidt Automotive, attributed the decline in Norway partly to difficult comparisons with the previous year, when buyers accelerated purchases ahead of a fiscal policy change.

Tesla’s European sales have rebounded this year after two consecutive annual declines, helped by easier comparisons, higher fuel prices, government incentives and growing consumer interest in electric vehicles.

Registration data from the UK and Germany, Europe’s two largest car markets, is due later this week and could provide additional insight into Tesla’s sales performance across the region.

The post Tesla stock falls 3%: here's what's dragging the stock down today appeared first on Invezz