Archive

September 10, 2026

Browsing

Useless, a Solana-based memecoin, has gained more than 900% from its August low to trade near $0.316 on Wednesday.

The rally carried USELESS to its highest level since October 2025 and placed the token among the strongest-performing memecoins over the period.

However, derivatives positioning and technical indicators warn that the advance may be becoming increasingly fragile. 

Millions of dollars in leveraged long positions sit below the current price, creating the conditions for a potential liquidation cascade if USELESS begins to fall.

The token is also testing the upper boundary of an ascending broadening wedge while its Relative Strength Index displays a bearish divergence.

Together, these signals raise the possibility of a correction toward $0.16–$0.17, which would erase roughly half of USELESS’s current value.

Liquidation map shows heavy downside exposure

USELESS’s one-week liquidation heatmap reveals a significant imbalance between bullish and bearish leveraged positions.

If the token extends its rally to approximately $0.347, around $540,000 in cumulative short positions could be liquidated, according to CoinGlass data.

That potential short exposure is relatively small compared with the long positions sitting below the current market price.

A decline toward $0.10 could expose nearly $6.7 million in cumulative leveraged longs to liquidation. This means traders betting on further gains currently have much more capital at risk than those positioned for a decline.

The imbalance does not guarantee that USELESS will fall. However, it shows that a bearish move could generate considerably more forced activity than another modest increase.

The largest concentration of liquidity sits near $0.1483. Approximately $266,170 in long liquidations is concentrated at that specific price. 

Cumulative long liquidations could reach roughly $4.46 million if USELESS drops from its current level to that zone.

Liquidation clusters can act as price magnets because traders, market makers, and automated systems are aware of the large number of positions vulnerable around them.

When an asset reaches a major cluster, exchanges automatically close leveraged positions belonging to traders who no longer have sufficient collateral to cover their losses.

Those forced closures create additional selling pressure. That pressure can push the price into the next group of liquidation levels, creating a cascading decline.

The risk is particularly significant after a near-vertical rally because many traders may have entered leveraged positions at increasingly elevated prices.

USELESS could lose up to 70%

A decline from $0.337 to the $0.1483 liquidity zone would represent a drop of approximately 56%.

If the price extends lower toward $0.10, the correction would reach roughly 70%. These levels are potential liquidation destinations rather than fixed price targets. 

The heatmap estimates where leveraged positions could be closed if the market moves through those areas, but it does not predict that the price will necessarily reach them.

Still, the amount of downside exposure indicates that USELESS could experience sharp volatility if selling pressure begins to build.

A relatively small initial decline may force some long positions to close, potentially accelerating the move as additional liquidation thresholds are reached.

USELESS’s four-hour chart also displays an ascending broadening wedge. The formation consists of two diverging trendlines, with the price producing progressively wider highs and lows. It often reflects increasing volatility and weakening control by the prevailing trend.

Such a pattern can be especially concerning after an extended rally because it suggests that buyers and sellers are becoming increasingly aggressive while price action grows less stable.

USELESS is currently testing the wedge’s upper boundary around $0.32–$0.34 after rebounding from approximately $0.20.

A rejection from this trendline would strengthen the bearish scenario and could send the token toward the lower boundary of the formation.

Momentum has not confirmed USELESS’s latest price high. The token has produced a higher high on its four-hour chart, while the Relative Strength Index has formed a lower high compared with its previous peak.

This creates a bearish divergence.

The pattern indicates that the price is continuing to rise even as the momentum supporting the move weakens. Bearish divergences frequently appear before corrections, although they do not guarantee an immediate reversal.

USELESS could continue climbing despite the signal if buying volume remains strong. However, the divergence becomes more concerning when combined with the broadening wedge and the large concentration of leveraged longs below the market.

If USELESS is rejected from the wedge’s upper trendline, the price could retreat toward its lower boundary between $0.16 and $0.17.

The rising 100-period EMA on the four-hour chart sits near $0.163, strengthening that area as a potential support zone.

A decline from approximately $0.322 to $0.163 would amount to a correction of around 49%.

This target also sits relatively close to the major liquidation concentration around $0.1483. The alignment between technical support and leveraged positioning increases the importance of the broader $0.15–$0.17 region.

Buyers may attempt to defend that area if a correction occurs. Failure to hold it could expose the deeper $0.10 target and the remaining long liquidations below.

A break above $0.35 would weaken the bearish setup

The bearish outlook would lose strength if USELESS decisively breaks above the wedge’s upper boundary.

A sustained move beyond the $0.34–$0.35 resistance zone would invalidate or delay the expected correction and could trigger the relatively small cluster of short liquidations near $0.347.

For confirmation, the token would need to hold above the resistance area rather than producing a brief intraday spike.

Until that occurs, the combination of a 900% rally, bearish momentum divergence, and heavily concentrated long exposure leaves USELESS vulnerable to a sharp pullback.

The post USELESS price risks 50% correction after 900% rally appeared first on Invezz

The Concordium Foundation has appointed Per Ansgar, CEO of Geely Sweden Holdings AB, to its board.

Ansgar brings more than 26 years of experience across Volvo Cars, Polestar and the wider Geely group.

The appointment builds on a five-year relationship between Concordium and Geely that began in 2021 with a focus on autonomous driving.

The partnership was formalized in 2022 through a joint venture based in Wuxi, China.

Ansgar joins the Concordium board as the foundation expands its focus on infrastructure for verified digital interactions, including payments and AI agents.

The company said his industrial and operational experience will complement existing board expertise across cryptography, law, digital operations and business.

Here’s a tightened continuation that keeps the AI-agent and automotive use cases grounded in the company’s claims:

As companies deploy AI agents and software capable of initiating transactions, Concordium is developing infrastructure intended to establish who owns and authorizes those agents and who is accountable when transactions go wrong.

The foundation said Ansgar’s automotive industry experience is relevant to this development as machine-initiated payments move toward practical applications, including connected vehicles settling charging, toll, and service payments.

Ansgar has served as CEO of Geely Sweden Holdings since November 2024, after previously serving as the company’s chief financial officer.

Before joining Geely Sweden Holdings, he spent 26 years at Volvo Cars, including roles as deputy CFO and CFO of Volvo Cars China. He later served as CFO of Polestar.

Alongside his executive role, Ansgar holds board positions across the Geely group and serves on the nomination committee of Volvo Car AB.

The Concordium Foundation Board is chaired by founder Lars Seier Christensen and includes Ueli Maurer, professor of cryptography at ETH Zurich; Swiss commercial lawyer Simone Monnerat; and digital executive Nibras Stiebar-Bang.

The relationship between Concordium and Geely began with a shared view of the direction of automotive technology, including a vision for vehicles to interact directly with electric power providers, toll stations, service stations and tax systems through machine-initiated payments.

Ansgar’s appointment brings Geely leadership into Concordium’s governance as the network develops infrastructure for this model.

The company said the system is intended to allow verified AI agents, alongside verified humans, to conduct transactions while remaining linked to an accountable owner.

Concordium’s Agent Registry went live in May 2026 and has since registered more than 1,600 AI agents, according to the foundation.

Each registered agent is linked to a verified owner and carries a Verified by Concordium Badge that can be used across networks including Ethereum and Solana.

According to Concordium, the badge allows AI agents to provide verifiable information about their owners without exposing underlying company documents.

The post Concordium appoints Geely Sweden Holdings CEO Per Ansgar to Board appeared first on Invezz

Rocket Lab stock has slumped in recent months despite the company hitting several major milestones. Shares peaked at $150 in May before tumbling 56% to the current $65. This pullback could be a good buying opportunity, as a double-bottom pattern appears to be forming.

Rocket Lab has made some major milestones

RKLB, one of the top players in the space industry, is doing well as demand for its services continues rising. It has made some major contract announcements recently with organizations like the Space Force, Viasat, and MDA. 

Rocket Lab also announced the release of Inverted Metamorphic (IMM) Apex, which is the latest iteration of its next-generation solar cell designed to deliver efficiency and reliability for space applications. Brad Clevenger, the company’s president, said

“With IMM Apex, customers gain access to a high-efficiency, lightweight, germanium-free product that combines proven reliability with faster production times.

The company also announced strong financial results, which showed that its business continues to grow. Its revenue jumped by 62% in the second quarter to over $234 million. 

The revenue surge happened as its backlog soared to over $2.36 billion and management expects the surge to continue in the foreseeable future. For example, it expects its third-quarter revenue to come in between $250 million and $265 million, with its gross margin between 29% and 31%.

READ MORE: Cathie Wood buys $31.6M of Rocket Lab stock: is she betting the selloff went too far?

Analysts also expect that its revenues will come out stronger. The average estimate is that its annual revenue growth will be 59% to $958 million, followed by $1.36 billion next year. This revenue growth will be a 42% annual increase.

Rocket Lab has also delivered on other major milestones, including its $8 billion deal to acquire Iridium. The acquisition will give it highly sought-after spectrum and help unlock new markets. Specifically, Rocket Lab will gain access to the L-band spectrum, which could support additional services, potentially even a Starlink competitor.

Analysts are largely bullish on Rocket Lab shares. Berenberg initiated the coverage with a buy rating and a target of $83, much higher than where it is today. Bank of America’s Ronald Epstein has a target of $110, while Citizens’ Trevor Walsh has a target of $130. Some of the other top analysts with a bullish outlook on the company are from Cantor Fitzgerald, Citigroup, and Craig Hallum. 

Rocket Lab stock technical analysis

RKLB stock chart | Source: TradingView

The daily chart shows that the RKLB stock has retreated from a high of $150 in May this year to the current $65.87. It has dropped below the strong pivot/reverse level of the Murrey Math Lines tool at $75. 

The stock has slumped below 50-day and 100-day moving averages, a sign that bears are in control for now. On the positive side, the Relative Strength Index (RSI) has reversed and moved to 40, its highest level since August 24. 

The stock is also slowly forming a double-bottom pattern whose neckline is at $86.6, its highest point on August 10. A double-bottom pattern is a common reversal sign in technical analysis. 

Therefore, the stock will likely bounce back in the near term, with the next key target being the neckline at $86. A move above that level will point to more gains towards $100.

The post Rocket Lab stock is down 56% from its yearly high: Is this a buying opportunity? appeared first on Invezz

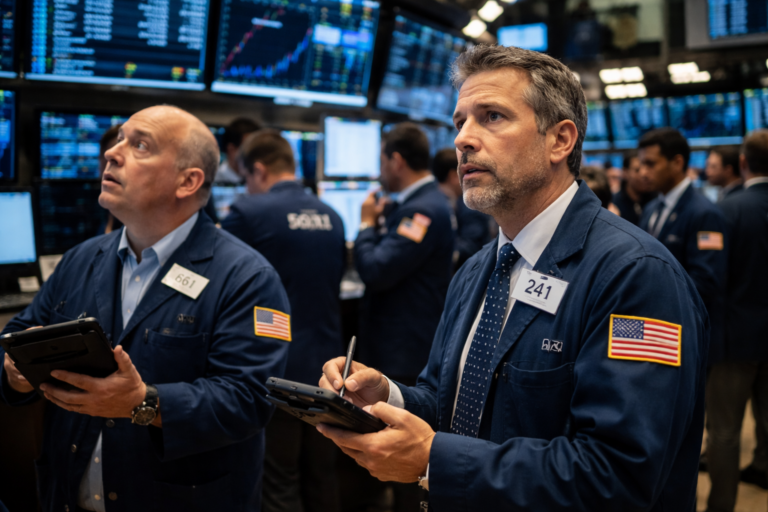
US stocks fell on Wednesday as oil prices climbed above $100 a barrel, raising concerns about inflation and the Federal Reserve’s interest-rate path.

The Dow Jones Industrial Average fell 288 points while the S&P 500 declined 0.25%. The Nasdaq Composite shed 0.42%.

Oil prices fuel inflation concerns

Brent crude rose more than 2% to break above the $100-a-barrel mark for the first time since July, as escalating tensions between the US and Iran increased concerns about disruptions to Middle East energy supplies.

West Texas Intermediate crude futures also remained above $91 a barrel. The latest move extended oil’s gains from the previous session, when rising energy prices contributed to losses across the major US stock indexes.

The Dow Jones Industrial Average fell 1.2% on Tuesday, its worst session in almost three weeks. The S&P 500 and Nasdaq Composite declined 0.6% and 0.3%, respectively.

Higher oil prices have also pushed Treasury yields higher as investors assess the potential inflationary impact of more expensive energy. The 10-year Treasury yield briefly moved above 4.8% on Tuesday.

Fed rate outlook comes into focus

Investors are also assessing the Federal Reserve’s next policy decision as higher energy prices could complicate the inflation outlook.

Markets now see a 62.4% probability of a 25-basis-point rate increase at the Fed’s meeting next week, according to CME FedWatch data. The expectation has increased as policymakers continue to focus on inflation.

Upcoming economic data is expected to play a key role in determining the central bank’s next move.

Producer Price Index data is due Thursday, followed by the Consumer Price Index report on Friday.

The CPI reading will be particularly important because it is the final major inflation report available to policymakers before the September meeting.

Investors are also watching a planned US Treasury announcement on bond buybacks. The Treasury has said it would purchase more longer-dated bonds to help address rising yields.

Any reaction in the bond market could influence equities because higher government bond yields can weigh on stocks.

Tech stocks and individual movers

Technology and semiconductor stocks were under pressure. Intel declined 0.95%, and Nvidia slipped 0.28%. Apple stock fell 0.11% before it unveils the folded iPhone.

Investors remain focused on artificial intelligence stocks, although concerns have emerged around companies involved in financing transactions with one another.

These arrangements have raised questions about the sustainability of revenue growth across parts of the AI industry.

Elsewhere, Dow Inc. rose in trading after a report said the chemicals company was considering exiting its $20 billion partnership with Saudi Aramco.

Meta shares gained 4.7% after the company launched an AI assistant capable of performing tasks including sending emails, selling a car and booking travel.

The broader weakness extended beyond the US. Europe’s Stoxx 600 was down 0.69%, while major indexes in the UK, Germany, France and Italy also traded lower.

In Asia, Japan’s Nikkei 225 declined 0.19%, while South Korea’s Kospi rose 1.4% and China’s CSI 300 gained 0.3%.

The post Dow opens 280 pts lower as oil tops $100, fueling Fed rate hike concerns appeared first on Invezz

Gold and silver rose in early trading Wednesday as investors sought safety amid escalating US-Iran tensions, even as oil’s surge past $100 a barrel and elevated Treasury yields worked against the metals.

Spot gold traded near $4,417.87, up 1.46%, while spot silver was at $67.37, up 2.46%, according to Wednesday’s market pricing.

Oil spike and a weaker dollar support metals

Brent crude was trading at $100.72 a barrel, while WTI crude had risen to $95.70.

The US dollar weakened against major currencies, which typically makes gold and silver cheaper for buyers holding other currencies and adds support to prices.

Even so, Treasury yields stayed elevated, with the 10-year yield near 4.81%, its highest level since October 25, 2023, a headwind that usually pressures non-yielding assets like gold and silver.

Strait of Hormuz in focus

Tensions escalated further after Iran attacked US warships in the Gulf of Oman late Tuesday.

The US responded Wednesday by destroying five Iranian oil tankers, according to a senior US defense official.

Unverified reports also emerged Wednesday that Iranian vessels were preparing to move into the Strait of Hormuz, a 90-mile waterway that has carried around 21% of global oil supplies.

Those vessels were later reported to have turned back toward Iran.

The escalation follows Saturday’s attacks on two US warships in the Gulf of Oman, part of a broader pattern of tit-for-tat strikes between the two countries in recent days.

Inflation data looms large

Markets are currently pricing a 60% chance the Federal Reserve raises rates by 25 basis points at its meeting on September 15-16.

That outlook will be tested by two key inflation readings this week: the Producer Price Index on Thursday and the Consumer Price Index on Friday.

Given the recent jump in oil prices, both reports are likely to carry more weight than usual with policymakers and traders.

Analysts describe the setup for metals as mixed.

Higher crude prices and higher yields typically weigh on gold and silver, but in the short term, a weaker dollar, safe-haven demand, and uncertainty over Gulf oil supply are offsetting that pressure.

Key levels to watch

Gold is trading between support at $4,347 and resistance at $4,422.

A break above resistance opens the door to targets at $4,465 and $4,512, while a drop below support could send prices toward $4,290 and then $4,263.

Silver has support at $64.73, with a break lower potentially opening a path to $62.57. On the upside, clearing $67.21 could push prices toward $68.74 and then $70.76.

Traders say gold’s near-term direction now hinges almost entirely on Thursday’s and Friday’s inflation data.

A hotter-than-expected reading would likely keep yields elevated and cap the metals’ rally, while a softer print could ease rate expectations and open room for gold to break higher.

The post Gold nears $4,420 as Middle East tensions drive haven demand appeared first on Invezz