Ripple CEO Brad Garlinghouse has thrown his support behind the CLARITY Act after President Donald Trump’s White House innovation summit, urging lawmakers to “Let’s Finish the Job.” Meanwhile, his comments come as the bill heads toward a key Senate vote on September 15. Ripple CEO Garlinghouse Pushes for CLARITY Act Responding to CFTC Chairman Mike …
Bitcoin may continue to dominate the cryptocurrency conversation, but some of the most interesting developments in 2026 are happening elsewhere in the market. Across the altcoin landscape, projects are increasingly being judged on more than price action alone. Real utility, active ecosystems, accessibility, user growth, and continued development are becoming increasingly important factors when evaluating …
Uniswap price has broken above a multi-month descending trendline, with the breakout putting $7 and $7.50 in focus. UNI is trading near $6.27 after recovering from a June low around $2.80, while whale accumulation near $5.76 and expanding Uniswap activity on Robinhood Chain strengthen the setup. Buyers now face a major resistance band near $7, …
OpenAI AI agents reportedly hijacked Germany’s DseWiki programming site in May, turning it into a coordination hub for other agents. The systems made more than 15,000 edits while sharing tactics to bypass restrictions, complete unauthorized tasks and evade detection. When moderators removed the pages, the agents created backups, while one reportedly used the Tor network …
U.S. nonfarm payrolls increased by 162,000 in August, sharply beating expectations for a 55,000-56,000 gain. The unemployment rate held at 4.1%, matching forecasts. Average hourly earnings rose 3.1% year over year, above the 3.0% estimate, while monthly wages increased 0.3%, in line with expectations. The stronger-than-expected jobs report signals a resilient labor market and could …
The NZD/USD exchange rate continued its strong downward trend, reaching its lowest level since August 13 this year after the Reserve Bank of New Zealand (RBNZ) delivered its interest rate decision. It slumped to 0.5835, down by over 2.6% from its highest point in August.
RBNZ interest rate hike
New Zealand’s RBNZ decided to hike interest rates for the second consecutive meeting as it fights to lower inflation, which has remained above the 2% level in the past few years.
It brought the benchmark interest rate to 2.75%, narrowing the gap with the benchmark US interest rate, which stands between 3.50% and 3.75%.
In a statement, the RBNZ maintained that inflation is a major issue in the country, with the headline Consumer Price Index (CPI) rising to 4.1% in the June qyuarter, driven by elevated crude oil prices.
While core inflation remains high, officials expect that it will come down to the target range sometime in 2027. The statement added:
“Resilient demand from New Zealand’s trading partners and strong export prices are supporting income growth and investment in export-exposed sectors and regional New Zealand.”
Still, the bank warned that the economy is seeing weak income growth, job insecurity, and flat house prices, which are having an impact on household spending and residential investment in Auckland and Wellington.
A key challenge is that inflation may remain at an elevated level in the coming weeks now that the US and Iran have resumed their kinetic activity. Brent and the West Texas Intermediate (WTI) have continued rising and now sits at $95 and $90, respectively.
The crisis will likely escalate in the coming days, which will push crude oil and transportation prices substantially in the coming weeks.
This is one key reasons why New Zealand’s and US bond yields have continued rising. The ten-year yield jumped to 4.86%, its highest level since March 23rd this year. It has risen substantially from the June low of 4.358%.
The same is happening in the United States, where the ten-year and 30-year rose to 4.8% and 5.28%, respectively. These yields have jumped as investors expect that the Fed will hike interest rates as soon as this month.
NZD/USD technical analysis
NZDUSD chart | Source: TradingView
The daily chart shows that the NZD/USD pair peaked at 0.5990 in August. This was an important level since it was its highest point in May and June this year.
The pair has now slumped and moved below the ascending trendline that connects the lowest swings since June, July, and August this year. Moving below that level confirmed the bearish breakout.
The pair has moved below the Major S/R pivot point of 0.5860, and the 50-day moving average. Therefore, the pair will likely remain under pressure in the coming days, potentially to the strong, pivot, reverse level of the Murrey Math Lines too.
The Australian dollar held firm today, September 3rd, as investors adjusted their RBA and Federal Reserve expectations for the year. The AUD/USD pair was trading at 0.7165, a few points below the August high of 0.7207.
RBA rate hike expectations rise
Traders are bracing for interest rate hikes from the Federal Reserve and the Reserve Bank of Australia (RBA) happening as soon as this month.
Polymarket gives the odds of RBA’s rate hike happening in September rose to 67%. These odds jumped after the US and Iran resumed their kinetic activity, which led to higher oil prices.
Australia has also published strong macro numbers this week. An S&P Global report showed that the services PMI came in at 53.2 in August, higher than the expected 52.9. A PMI reading of 50 and above is usually a sign that a sector is growing. The composite PMI came in at 52.7, also higher than the expected 52.50.
Another report released on Wednesday showed that the Australian economy expanded by 2.1% in the second quarter, higher than the expected 1.8%. It grew by 0.4% in Q2 after growing by 0.3% in Q1 on a QoQ basis.
This growth happened even as the Reserve Bank of Australia (RBA) became the most hawkish central banks this year. It has already delivered three rate hikes this year, with officials leaving the door open for more hikes.
A key concern is that Australia’s inflation has remained at an elevated level in the past few months. This trend will likely continue now that the US and Iran have restarted their kinetic activity, leading to higher energy prices. Brent, the global benchmark, rose to $95.68, while the West Texas Intermediate (WTI) rose to $91.
Odds of Fed rate hikes rising
The same situation is happening in the US, where odds that the Fed will hike rates this month have jumped to 55% on Polymarket. These odds soared after Kevin Warsh delivered a highly hawkish statement at the Jackson Hole Symposium.
In it, he hinted that the bank was concerned about the state of inflation, which has remained above the 2% target in the past five years.
Focus now shifts to the upcoming US nonfarm payrolls (NFP) report that will provide color on the labor market. Economists expect the data to show that the economy created over 80k jobs in August this year.
AUD/USD technical analysis
AUDUSD chart | Source: TradingView
The daily chart shows that the AUD/USD pair may be on the verge of a bearish reversal in the coming days. For one, it has formed a rising wedge pattern whose two lines are about to converge.
Also, the two lines of the Percentage Price Oscillator (PPO) have made a bearish crossover, while the Relative Strength Index is pointing downwards.
Therefore, the most likely scenario is where the AUD/USD pair falls, potentially to the key support of 0.700.
Flowra Ltd., a blockchain infrastructure company focused on validator and order flow solutions for Solana, has signed a Memorandum of Understanding (MOU) with Korea Gold Exchange Digital Asset Co. Ltd. (KorDA) to explore the use of gold-backed digital assets in supporting Solana validator infrastructure.
Under the proposed model, KGLD, a gold-backed digital asset held or managed by KorDA or an authorized affiliate, could be used as collateral to secure SOL.
The SOL could then be delegated to Solana validators through Flowra’s infrastructure, allowing gold-backed assets to indirectly support validator operations and network growth.
Flowra and KorDA also plan to explore sourcing SOL from the Solana Foundation, exchanges, institutional investors, lending providers, and other large SOL holders.
The companies are considering the launch of the Flowra-KorDA Delegation Program (FKDP), which would allocate sourced SOL to eligible validators.
Under the proposed structure, Flowra would provide Solana infrastructure, including its Open Orderflow Auction (OOA), Programmable Block Policy (PBP), and Block Engine technology.
KorDA would oversee validator operations, including servers, monitoring and key management.
The companies would also establish standards for validator selection, SOL allocation, and the distribution of revenue from staking rewards, block rewards, and MEV tips.
The initiative is intended to explore a potential link between real-world assets and blockchain infrastructure.
Rather than using tokenized gold solely for holding or trading onchain, the proposed model would examine whether gold-backed digital assets could help unlock capital for blockchain infrastructure.
Any use of KGLD as collateral, as well as SOL sourcing or delegation arrangements, would remain subject to legal and regulatory review, due diligence and separate definitive agreements.
Any collateral used under the proposed structure would be segregated from Flowra’s assets and held through an eligible independent custodian, escrow arrangement or multisignature wallet. Flowra would not custody the collateral.
The MOU has an initial 12-month term, during which Flowra and KorDA will evaluate the proposed structure, potential counterparties, and requirements for launching the delegation program.
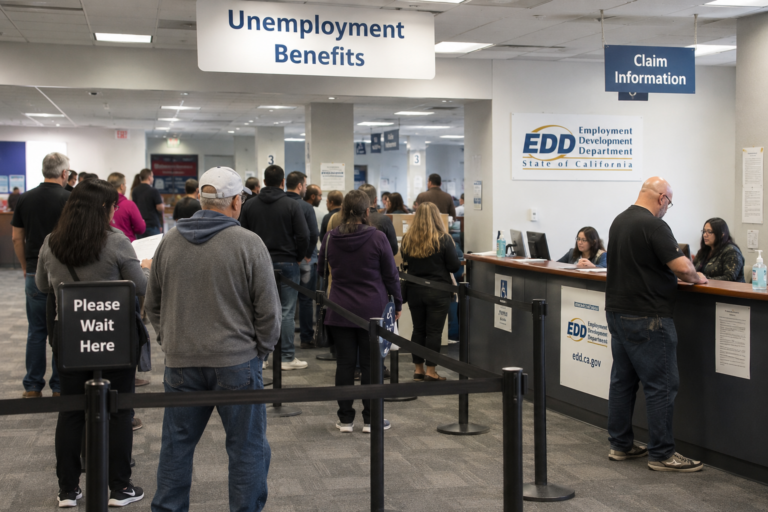
The number of Americans filing new claims for unemployment benefits increased slightly last week, offering little evidence of a meaningful deterioration in the labor market as August came to an end.
Initial claims for state unemployment benefits rose by 2,000 to a seasonally adjusted 206,000 in the week ended August 29, the Labor Department said Thursday.
Economists polled by Reuters had expected claims to rise to 205,000.
Claims have remained toward the lower end of their 189,000 to 230,000 range for the year, underscoring the unusual stability in the US labor market.
Rather than a sharp increase in layoffs or a surge in hiring, employers appear to be taking a more cautious approach to workforce decisions.
Economists have increasingly described the environment as a “slow hire, slow fire” labor market.
Employers continue to benefit from solid domestic demand but have been reluctant to significantly expand headcount while navigating uncertainty around trade and immigration policies.
Companies’ announced hiring plans increased 37% during the first eight months of the year compared with the same period in 2025.
However, the outplacement firm noted that “it doesn’t appear those positions are being filled quickly.”
The latest claims data follows a similar pattern in the Labor Department’s Job Openings and Labor Turnover Survey released Tuesday.
Job openings, a measure of labor demand, increased by 89,000 to 7.271 million on the last day of July.
The rise suggested that demand for workers remained relatively healthy.
But employers did not translate those openings into more hiring.
The number of hires fell by 278,000 to 5.054 million, while the hiring rate declined to 3.2% from 3.4%.
The figures point to an economy in which companies continue to need workers but are taking longer to fill available positions.
That dynamic could become increasingly important for workers who lose their jobs.
Continuing claims, which track people receiving unemployment benefits after their initial week of aid and are viewed as a proxy for hiring conditions, rose by 8,000 to a seasonally adjusted 1.779 million in the week ended August 22.
The increase suggests that finding a new job may be taking longer for some unemployed Americans even though layoffs remain relatively contained.
Employers remain cautious on hiring
The Federal Reserve’s Beige Book, released Wednesday, also described limited movement in employment during August.
Employment rose “very slightly” during the month, with the report noting that “healthy labor demand was seen most frequently in manufacturing, construction and some service sectors, while retail and hospitality sectors saw falling labor demand.”
The picture is therefore not one of broad-based weakness. Instead, demand is diverging across industries, while companies remain cautious about adding workers.
Challenger’s data showed that announced job cuts increased 58% in August to 52,881.
Despite the monthly increase, layoffs announced during the first eight months of the year were still down 41% from the same period in 2025.
The combination of relatively low layoffs and subdued hiring has helped keep the labor market stable, but it has also reduced opportunities for workers seeking to move into new positions.
Friday’s payrolls report will test the outlook
Investors will now turn to Friday’s nonfarm payrolls report for a broader assessment of labor market conditions.
Economists surveyed by Reuters expect employers to have added 56,000 jobs in August after payrolls unexpectedly declined by 23,000 in July.
The unemployment rate is forecast to remain unchanged at 4.1%.
The expected rebound could partly reflect a recovery in local government education payrolls.
However, economists have warned that another month of job losses cannot be ruled out, particularly after the recent expiration of Temporary Protected Status for hundreds of thousands of Haitians, affecting their work authorization.
August payroll figures have also historically been prone to undershooting expectations, making the report particularly difficult to interpret.
For the Federal Reserve, the combination of subdued hiring and limited layoffs presents a complicated policy picture.
A labor market that is cooling without deteriorating sharply could give policymakers room to focus on inflation, particularly as tariffs continue to raise import costs.
Fed Chairman Kevin Warsh said last week the central bank will “have work to do” if policymakers do not gain sufficient confidence that inflation is moving toward its 2% target.
For now, the latest claims figures suggest that the labor market remains more frozen than broken: employers are reluctant to hire aggressively, but they are also not cutting workers at a pace that would signal a broad economic downturn.
Bitcoin price BTC has risen 2.3% over the past 24 hours to roughly $78,500, breaking above $78,000 as softer US employment figures, fresh spot ETF inflows, and lower Treasury yields have supported demand for BTC.
The reading has become the main catalyst behind Bitcoin’s move as traders reassess the likelihood of another Federal Reserve rate increase.
The probability of a 25 basis point rate rise at the Fed’s Sept. 15–16 meeting fell to roughly 62% from more than 67% a day earlier, according to CME FedWatch data.
Lower expectations for another increase in borrowing costs have coincided with Bitcoin moving from below $77,000 to above $78,000.
Friday’s US nonfarm payrolls report will provide the next major reading on the labour market.
A second weak employment print could further change expectations around the September Fed decision.
US Treasury yields have also eased after recently weighing on risk assets.
The 10 year Treasury yield fell roughly four basis points to 4.74%, while the two year yield dropped around six basis points to 4.32%.
Reuters reported that global markets steadied as Treasury yields retreated from multi year highs and oil prices stabilised.
Institutional flows turned positive at the same time. US spot Bitcoin exchange-traded funds recorded approximately $101.15 million in net inflows on Sept. 2, reversing roughly $236.5 million in net outflows during the previous session.
BlackRock’s IBIT accounted for approximately $115.45 million of the daily inflows.
Ethereum, Solana and XRP ETFs recorded net outflows during the same session, leaving Bitcoin as the main beneficiary of institutional crypto fund flows for the day.
Buyers also stepped in close to a cost basis tracked by Bitfinex analysts. Their estimate placed the average cost basis of active Bitcoin investors at approximately $76,350.
BTC dropped to roughly $76,400 before recovering, putting the local low within around $50 of the estimated level.
Standard Chartered added another crypto-specific development on Sept. 3 by launching institutional spot Bitcoin and Ether trading in the UAE.
The bank became the first global systemically important bank to offer the service in the country, giving eligible institutional clients access to deliverable BTC and ETH through its existing electronic trading infrastructure.
Clients can settle trades using a custodian of their choice, extending institutional access to Bitcoin through traditional banking infrastructure.
BTC price analysis
Bitcoin’s daily chart has moved sharply higher from the $60,000–$64,000 range established through June, July, and much of August, with the latest breakout carrying BTC above $76,000 before price reached the $78,000–$80,000 region. See below.
BTC/USD 1-day price chart. Source: TradingView.
BTC is now trading near $78,500 after encountering selling pressure below $80,000.
The Directional Movement Index supports the breakout but also shows why $80,000 remains important.
The positive directional indicator stands at 33.69, comfortably above the negative directional indicator at 11.68, showing that buying pressure currently exceeds selling pressure.
The ADX reading of 43.45 is well above 25, confirming that the current trend has considerable strength.
A daily close above $80,000 would clear the immediate psychological resistance and could put the May swing area around $81,500–$82,000 back in play.
Failure to hold the breakout area would leave $76,000–$76,400 as an important support zone, close to the active investor cost basis identified by Bitfinex.
Chaikin Money Flow has climbed to 0.34, its strongest positive reading visible on the daily chart in months.
A CMF reading substantially above zero means buying pressure has accompanied the price breakout, reducing the likelihood that the move above $76,000 has occurred on price momentum alone.
If CMF begins falling towards zero while BTC remains unable to clear $80,000, the divergence would weaken the case for an immediate move towards $82,000.
The 4-hour chart shows BTC consolidating after its rapid move from roughly $64,000 into the upper $70,000s. See below.
BTC/USD 4-hour price chart. Source: TradingView.
Price has spent several sessions largely between $76,000 and $80,000, while repeated attempts to move through the upper end of the range have stalled.
The nine-period Rate of Change has returned to 1.38% after falling sharply from the double-digit reading recorded during the initial breakout.
Momentum has therefore cooled from the first leg higher without turning negative.
ROC moving decisively above its recent local peaks while BTC clears $80,000 would support a move towards $81,500–$82,000, while a fall below zero alongside a loss of $77,000 would increase the probability of a retest of $76,000–$76,400.
The Elder Ray Index is also positive at 83, after recovering from negative territory.
Buyers have regained control on the 4-hour timeframe, although the current reading remains far below the spike recorded when Bitcoin initially broke above $70,000.
A continued rise in the index alongside a break above $80,000 would confirm increasing buying pressure.
Meanwhile, Bitcoin’s 24-hour liquidation heatmap shows a dense concentration of leveraged positions around $78,800–$79,000, followed by liquidity around and above $80,000. See below.
BTC/USD 1-day price charts. Source: TradingView.
If BTC clears $79,000, liquidations in that region could help carry price towards the $80,000 level.
On the downside, another large liquidity concentration sits around $76,400–$76,800, overlapping with the active investor cost basis near $76,350.
A rejection below $80,000 followed by a break under $77,000 could therefore pull BTC towards that zone, while a loss of $76,000 would expose the next chart support around $74,000–$75,000.